Suppose that Max is a climate change scientist and butterfly enthusiast. In Max's locale, the mean summer temperature over the last ten years was higher than it was in the previous ten years. Max wonders if the size of adult male monarch butterflies has changed with the temperature difference. He knows that in his locale, historically, the mean rear wing length of adult male monarchs was 38.3 mm. He collects a random sample of ?n adult male monarchs to compare to the historical average. His sample data is shown in the given stem-and-leaf plot, where the stem unit is mm and the leaf unit is tenths of a mm. 35 I 1 2 36 I 5 6 7 8 37 I 0 1 2 3 5 6 8 38 I 0 2 4 4 8 9 39 I 3 5 Leaf Unit = 0.1 From experience, Max knows that the rear wing length of monarch butterflies is normally distributed. He decides to use a t-test with a significance level of α = 0.05 to test the null hypothesis, ?0 : ?=38.3against the alternative hypothesis, ?1 : ? ≠ 38.3, where μ is the population mean. If the requirements for a t-test have not been met, only state the test decision and conclusion. Otherwise, find the mean, standard deviation, t-statistic, ?-value,P-value, and state the test decision and conclusion.


Suppose that Max is a climate change scientist and butterfly enthusiast. In Max's locale, the mean summer temperature over the last ten years was higher than it was in the previous ten years. Max wonders if the size of adult male monarch butterflies has changed with the temperature difference. He knows that in his locale, historically, the mean rear wing length of adult male monarchs was 38.3 mm. He collects a random sample of ?n adult male monarchs to compare to the historical average. His sample data is shown in the given stem-and-leaf plot, where the stem unit is mm and the leaf unit is tenths of a mm.
35 I 1 2
36 I 5 6 7 8
37 I 0 1 2 3 5 6 8
38 I 0 2 4 4 8 9
39 I 3 5
Leaf Unit = 0.1
From experience, Max knows that the rear wing length of monarch butterflies is
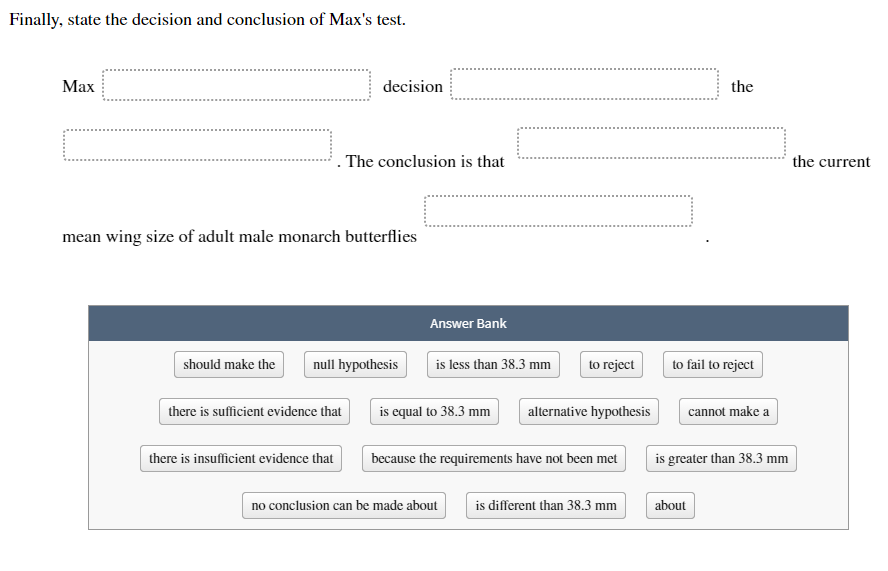
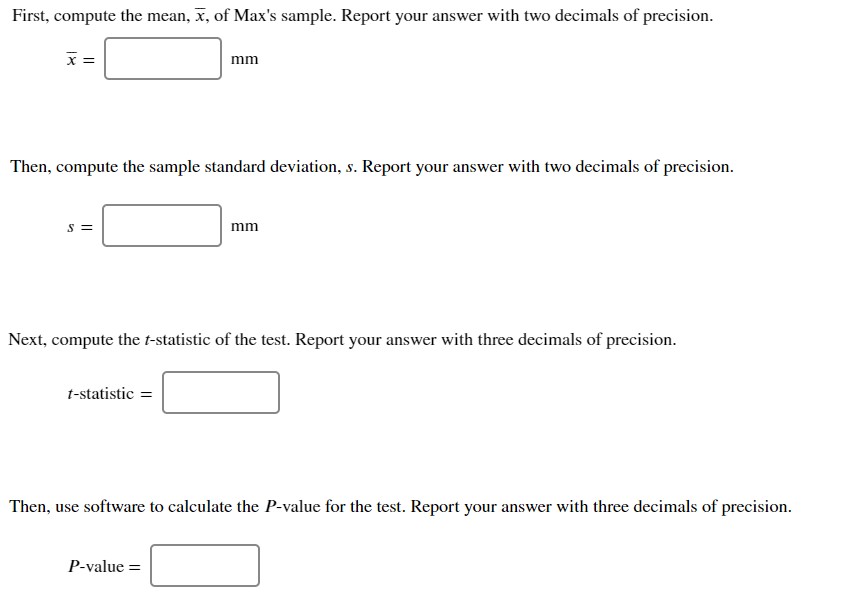
If the requirements for a t-test have not been met, only state the test decision and conclusion. Otherwise, find the mean, standard deviation, t-statistic, ?-value,P-value, and state the test decision and conclusion.


Trending now
This is a popular solution!

Step by step
Solved in 5 steps


