Suppose that the annual rates of growth of real GDP in Econoland over a five-year period were as follows: Year Growth Rate (%) 1 2 2 3 -2 4 a. What was the average of these growth rates in Econoland over these five years? Instructions: Enter your answer rounded to 1 decimal place. percent b. What term would economists use to describe what happened in year 3? (Click to select) ♥ c. If the growth rate in year 3 had been a positive 5 percent rather than a negative 2 percent, what would have been Econoland's average growth rate over the five years?
Suppose that the annual rates of growth of real GDP in Econoland over a five-year period were as follows: Year Growth Rate (%) 1 2 2 3 -2 4 a. What was the average of these growth rates in Econoland over these five years? Instructions: Enter your answer rounded to 1 decimal place. percent b. What term would economists use to describe what happened in year 3? (Click to select) ♥ c. If the growth rate in year 3 had been a positive 5 percent rather than a negative 2 percent, what would have been Econoland's average growth rate over the five years?

Principles of Economics 2e
2nd Edition
ISBN:9781947172364
Author:Steven A. Greenlaw; David Shapiro
Publisher:Steven A. Greenlaw; David Shapiro
Chapter20: Economic Growth
Section: Chapter Questions
Problem 20RQ: For a high-income economy like the United States, what aggregate production function elements are...

Related questions
Question
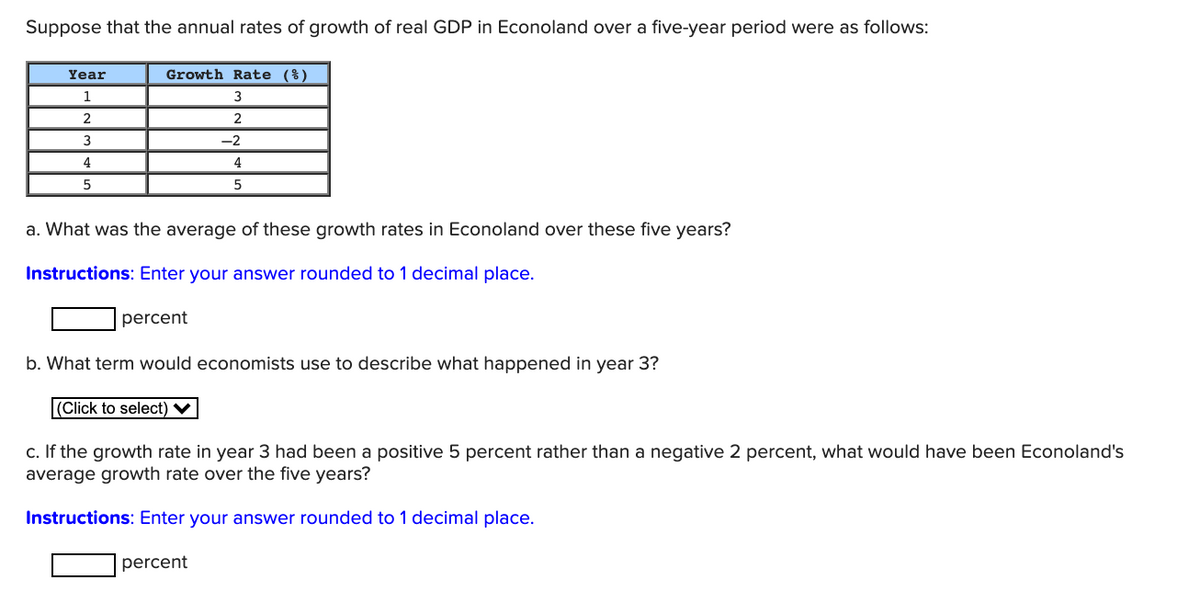
Transcribed Image Text:Suppose that the annual rates of growth of real GDP in Econoland over a five-year period were as follows:
Year
Growth Rate (%)
1
3
2
2
3
-2
4
4
5
a. What was the average of these growth rates in Econoland over these five years?
Instructions: Enter your answer rounded to 1 decimal place.
percent
b. What term would economists use to describe what happened in year 3?
|(Click to select) ♥
c. If the growth rate in year 3 had been a positive 5 percent rather than a negative 2 percent, what would have been Econoland's
average growth rate over the five years?
Instructions: Enter your answer rounded to 1 decimal place.
percent
Expert Solution
Step 1
To estimate the average growth rates in Econoland over the 5 years, we will add the economic growth of each year and divide it by the total number of years.
So, the average annual growth rate is 2.80%,

Trending now
This is a popular solution!

Step by step
Solved in 3 steps

Knowledge Booster


Learn more about
Need a deep-dive on the concept behind this application? Look no further. Learn more about this topic, economics and related others by exploring similar questions and additional content below.Recommended textbooks for you
Principles of Economics 2e
Economics
ISBN:
9781947172364
Author:
Steven A. Greenlaw; David Shapiro
Publisher:
OpenStax
Principles of Economics 2e
Economics
ISBN:
9781947172364
Author:
Steven A. Greenlaw; David Shapiro
Publisher:
OpenStax