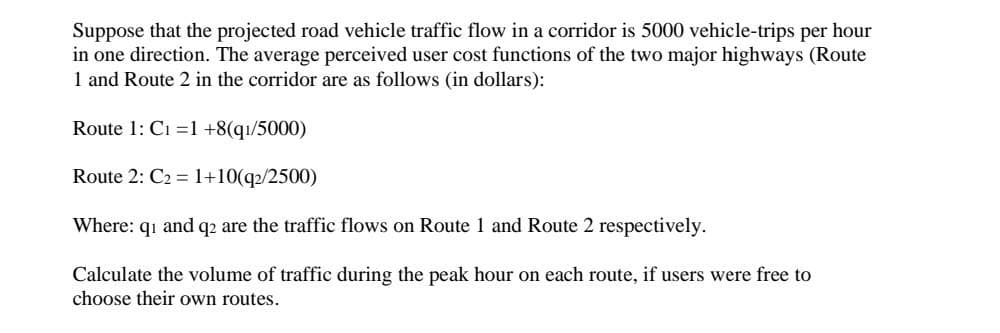
Suppose that the projected road vehicle traffic flow in a corridor is 5000 vehicle-trips per hour in one direction. The average perceived user cost functions of the two major highways (Route 1 and Route 2 in the corridor are as follows (in dollars): Route 1: Ci =1 +8(qı/5000) Route 2: C2 = 1+10(q2/2500) Where: qi and q2 are the traffic flows on Route 1 and Route 2 respectively. Calculate the volume of traffic during the peak hour on each route, if users were free to choose their own routes.
Q: 6. There are five alternatives for improvement of a road. Determine which alternative should be…
A: For calculating the best alternative we have lots of method to for finding the alternative in that…
Q: wo routes connect a city and suburb. During the peak-hour morning commute, a total of 5000 vehicles…
A:
Q: On a certain bus terminal, there are two terminals that can travels to the south. The number of…
A: Given Data:Number of terminals for south =2Passengers going to south = 150Capacity for ride/mun= 100
Q: After observing arrivals and departures at a highway toll booth over a 60-minute time period, an…
A: Given data Arrival rate λt=2.2+0.17t-0.0032t2departure rate μt=1.2+0.07tType of queue is D/D/1…
Q: A new route for 19000 trips will be open. Using the data below, what is the most likely mode of…
A: Given, A new route for 19000 trips v tij w tij t tij Fij ϕj Coefficient (a) 0.007 0.002…
Q: Vehicles are known to arrive according to a Poisson Equation at a specific spot on a highway.…
A: Given data, Recording time interval = 25 seconds Total number of intervals = 250 Intervals with 3…
Q: Given that a zone has 200 households with car and 200 households without car and the average trip…
A: It is required to determine the growth factor.
Q: The performance function for a highway connecting a suburb with the business district can be…
A:
Q: Three routes connect an origin and destination with performance function t; = a¡ + bjxj/c¡ (with t's…
A: travel time in minutes is given as ti=ai+bixiciwhere ti= is in minutes and x=vehicles in…
Q: 8.4 Consider a Poisson regression model for the number of social/recreational trips generated during…
A: Given Data: The total number of members in the household = 5 The number of members in the household…
Q: e cycle l
A: Cycle length is composed of the total signal time to serve all of the signal phases including the…
Q: On a certain bus terminal, there are two terminals that can travels to the south. The number of…
A: Part 2 Average waiting time in the queue =100/150= 0.665 Hence option B is correct Part 1…
Q: Three routes connect an origin to a destination with the following link performance functions: t_1 =…
A: Given data, t1 = 8+0.5x1 t2 = 1+2x2 t3 = 3+0.75x3 x1+x2+x3 = 4000
Q: vay tm= 2.5 seconds (gap) in sQ = 200 vehicles per hour,
A:
Q: The performance function for a highway connecting a suburb with the business district can be…
A:
Q: Consider the Poisson trip generation model in Example 8.4. Suppose that a household has five members…
A: Given data:- Annual income $150000 and retail employment 320. We have to determine the probability…
Q: The performance function for a highway connecting a suburb with the business district can be…
A:
Q: A new route for 19000 trips will be open, Using the data below, what is the most likely mode of…
A:
Q: d and supply function for a bridge are the following where C is cost in cents and V is volume in veh…
A: Volume=V=1500 - 10C Supply or cost function: C = 120 + 0.5Vso,EquilibriumV=1500 - 10120 + 0.5VSolve…
Q: Given that the value of a segment of roadway is 720 vehicle/hr, where the arrival of vehicles is a…
A: Given above a question is the arrival of vehicles in a Poisson distribution and it has been asked to…
Q: 4. The present trip ends and travel time matrix between the zones are shown in Tables 6.75 and 6.76,…
A: We have to determine the value of trip interchanges between the zones by using the gravity model as…
Q: A convenience store has four available parking spaces. The owner predicts that the duration of…
A:
Q: Route 1 travel time is calculated as 10 minutes + 1 minute per 100 vehicles on it. Route 2 travel…
A:
Q: a. Determine the share (proportion) of person-trips by each of two modes (private auto and mass…
A: Uk=Ak-0.05Ta-0.04Tw-0.03Tr-0.014CUk=Measurable utilityAk=Calibration constantTa=Access time in…
Q: Grab taxis arrive at the Manila International Airport , according to a Poisson process, at the rate…
A:
Q: The following chart shows the average number of hours commuters spend in traffic delays per year at…
A: The above graph represents the average hours per year by commuters in different cities. Statement A…
Q: A large residential area has 1500 households with an average household income of $15,000, an average…
A: From the Given Dataneed to find change in %
Q: In 1-2 sentences only, explain why we compare different transport modes before selecting them in…
A: The transportation mode selection depends on all factors that are service cost for the…
Q: There are five alternatives for improvement of a road. Determine which alternative should be chosen…
A: The following table shows the Benefit / Cost ratio for the alternatives. Alternatives Annual…
Q: B- Discuss with the aid of graph the vehicle operation cycle, in public transportation.
A: Answer :- A full workday vehicle utilisation schedule was predicted using the data collected. The…
Q: The Jeffersonville Transportation Study Area has been divided into four large districts (traffic…
A: Solution :
Q: Determine the share (proportion) of person-trips by each of two modes (private auto and mass…
A:
Q: Two routes connect an origin and destination with performance function t; = a; + (x¡/cj)² (with t's…
A: Consider the given equation, ti=ai+xici2 For route 1 from the table, t1=5+x122 ...1 For…
Q: Determine the trip distribution matrix using "Gravity Model" of transport system with given the…
A:
Q: Find the optimal Solution of following transportation system
A: Given: Solve by using Simplex method
Q: Determine the share (proportion) of person-trips by each of two modes (private auto and mass…
A:
Q: Assuming user equilibrium before and during reconstruction, which proportion of the total demand…
A: Given data:- The flow X1 on route 1 before the reconstruction, X1=2.206×10³ Vehicles The peak hour…
Q: [T] The following table provides hypothetical data regarding the level of service for a certain…
A: 1st point : (600, 60) , 2nd point (1000, 57) , 3rd point (1500, 54 ) , 4th point (1900,…
Q: 4-step travel demand model"
A:
Q: 1. Assume that the following goals have been established for a transportation planning study. Goal…
A: The transportation system is always designed to meet the extreme provision of safety and maximum…
Q: Q2: A. Compute the mode choice (proportion of trips) by each of two modes (private automobile and…
A: Given:- Two modes are given i.e. Private automobile and mass transit A utility function is given UX…
Q: Calculate the cost
A: Dear student here i am answering to this problem according to our guidelines Step -1 include Basic…
Q: Consideration is being given to increasing the toll on a bridge now carrying 4500 veh/day. The…
A:
Q: 12.000 m 1600 m- Transport Costs (m3 /$) Effective Transport Distances (m) mj= Vx 1 l= 160 m2= Vx 2…
A: Given data Effective transport distance Transport cost To find Total cost
Q: VEN A TRANSPORTATION PROBLEM WITH THE FOLLOWING COSTS, SUPPLY, DEMAND, FD HE OPTIMAL SOLUTION: TO…
A: The given information is we have to calculate the optimal solution of the above question
Q: The total number of trips from ABC to XYC is 4500. All of the trips are made using car. The…
A:
Q: Situation 03: The number of crashes for a commuter airline with service between two cities located…
A: given- distance between cities d=200 milesnumber of crashes C=3time T=5 yearsNumber of flights per…
Step by step
Solved in 2 steps
- Three routes connect an origin to a destination with the following link performance functions: t_1 = 8 + 0.5 x_2 t_2 = 1 + 2x_2 t_3 = 3 + 0.75x_3 where t's in minutes and x's in thousands of vehicle per hour. If the peak-hour traffic demand is 4000 vehicles, determine the user equilibrium (UE) flows.Two routes connect a city and suburb. During the peak-hour morning commute, a total of 5000 vehicles travel from the suburb to the city. Route 1 has a 50km/hr speed limit and 5km in length, Route 2 has a 55km/hr speed limit and 4 km in length. Studies show that the total travel time on route 1 increases 2 mins for every extra 500 vehicles added. Mins of travel time on route 2 increase with the square of the no. of vehicles expressed in 000’s. Determine user equilibrium travel times.A large residential area has 1500 households with an average household income of $15,000, an average household size of 5.2, and, on the average, 1.2 working members. Using the model below, predict the change in the number of peak-hour social/recreational trips if employment in the area increased by 20% and household income by 10%. number of peak-hour vehicle-based social/recreational trips per household = 0.04 + 0.018(household size) + 0.009(annual household income [in thousands of dollars]) + 0.16(number of nonworking household members) Round off final answers to whole number.
- A large residential area has 1500 households with an average household income of $15,000, an average household size of 5.2, and, on the average, 1.2 working members. Using the model below, predict the change in the number of peak hour social/recreational trips If employment in the area increased by 20% and household income by 10%. number of peak-hour vehicle-based social/recreational trips per household 0.04 + 0.018(household size)+ 0.009(annual household income in thousands of dollars)+ 0.16(number of nonworking household members)Question:- Traffic counts in the year 2000 at a counting point on a national highway gave ADT as follows: 4000cars,1750 taxis,250 trucks,100 buses.National traffic growth in the area is expected to be 5% for private cars and taxis, 3% for trucks and buses.After improvements, generated traffic for the highway will be 20 % of the 2000 ADT.It is required to design the cross-section of the highway to satisfy the traffic needs by the year 2015 show all visible dimensions on a drawing sketch. Take:-K= 0.15PLC = 800 p.c.e'/hour.directional distribution (D) is 0.6Grab taxis arrive at the Manila International Airport , according to a Poisson process, at the rate of 10 per hour. a. What is the probability that exactly 5 taxis arrive during a 1-hour period? b. If we define a working day as 12 hours, what is the probability that at least 50 taxis arrive during a working day? c. What is the probability that at least 5 arrive during a 1-hour period? Kindly provide a complete solution in 3 decimal points.
- (show your formula) Given the figure above, compute for the Annual Average Daily Traffic of the Motorcycle: * a.233 B.181 C.None of the above D.228 E.183Determine the trip distribution matrix using "Gravity Model" of transport system with given the data: Trip Production of Zones 1, 2 and 3, correspondingly are 500, 600, and 800 tpd Trip Attraction of Zones 1, 2 and 3, correspondingly are 600, 700 and 600 tpd[T] The following table provides hypothetical data regarding the level of service for a certain highway. Plot vehicles per hour per lane on the x-axis and highway speed on the y-axis. Compute the average decrease in speed (in miles per hour) per unit increase in congestion (vehicles per hour per lane) as the latter increases from 600 to 1000, from 1000 to 1500, and from 1500 to 2100. Does the decrease in miles per hour depend linearly on the increase in vehicles per hour per lane? Plot minutes per mile (60 times the reciprocal of miles per hour) as a function of vehicles per hour per lane. Is this function linear? Highway Speed Vehicles per Hour per Lane Density Range (vehicles / mi) > 60 < 600 < 10 60 - 57 600 - 1000 10 - 20 57 - 54 1000 - 1500 20 - 30 54 - 46 1500 - 1900 30 - 45 46 - 30 1900 - 2100 45 - 70 < 30 Unstable 70 - 200
- A toll bridge carries 10,000 veh/day. The current toll is $3.00/vehicle. Studies have shown that for each increase in toll of 50 cents, the traffic volume will decrease by 1000 veh/day. It is desired to increase the toll to a point where revenue will be maximized. Let V be the Volume X be the increase in toll charge (a) Write the expression for travel demand on the bridge related to toll increase and current volume. (b) Determine the increase in toll charge (c) Determine the new toll charge to maximize revenues. (d) Determine traffic in veh/day after toll increase. (e) Determine total revenue increase with new toll.A work-mode-choice model is developed from data acquired in the field in order to determine the probabilities of individual travelers selecting various modes. The mode choices include automobile drive alone (DL), automobile shared-ride(SR), and bus (B). The utility functions are estimated as: UDL = 2.6 – 0.3(costDL) – 0.02(travel time DL) USR = 0.7 – 0.3(costSR) – 0.04(travel time SR) UB = –0.3(costB) – 0.01(travel time B) where cost is in dollars and time is in minutes. The cost of driving an automobile is $5.50 with a travel time of 21 minutes, while the bus fare is $1.25 with a travel time of 27 minutes. How many people will use the shared-ride mode from a community of 4500 workers, assuming the shared-ride option always consists of three individuals sharing costs equally?a vehicle purchased for 43,000 at a constant rate of 25% how many years it takes for the vehicle value to reach 17,000