Suppose that the true population mean u 99.2 and standard deviation o = 20.8 are unknown to the Delaware tourism board. They select a simple random sample of 50 full-service restaurants located within the state to estimate µ. The mean number of seats per restaurant in the sample is M = 103.4, with a sample standard deviation of s = 18.2. The standard deviation of the distribution of sample means (that is, the standard error, OM) is 2.94 ▼ (Note: Although u and o are unknown to the Delaware tourism board, they are known to you for the purposes of calculating these answers.) The standard or typical average difference between the mean number of seats in the 559 full-service restaurants in Delaware (u = 99.2) and one randomly selected full-service restaurant in Delaware is 2.94 The standard or typical average difference between the mean number of seats in the sample of 50 restaurants (M = 103.4) and one randomly selected restaurant in that sample is The standard or typical average difference between the mean number of seats in the 559 full-service restaurants in Delaware (u = 99.2) and the sample mean of any sample of size 50 is The z-score that locates the mean number of seats in the Delaware tourism board's sample (M = 103.4) in the distribution of sample means is Use the unit normal tables and accompanying figures to answer the question that follows. To use the tables, select the desired range of z-score values. A table of the proportions of the normal distribution corresponding to that range of z-scores will appear.
Suppose that the true population mean u 99.2 and standard deviation o = 20.8 are unknown to the Delaware tourism board. They select a simple random sample of 50 full-service restaurants located within the state to estimate µ. The mean number of seats per restaurant in the sample is M = 103.4, with a sample standard deviation of s = 18.2. The standard deviation of the distribution of sample means (that is, the standard error, OM) is 2.94 ▼ (Note: Although u and o are unknown to the Delaware tourism board, they are known to you for the purposes of calculating these answers.) The standard or typical average difference between the mean number of seats in the 559 full-service restaurants in Delaware (u = 99.2) and one randomly selected full-service restaurant in Delaware is 2.94 The standard or typical average difference between the mean number of seats in the sample of 50 restaurants (M = 103.4) and one randomly selected restaurant in that sample is The standard or typical average difference between the mean number of seats in the 559 full-service restaurants in Delaware (u = 99.2) and the sample mean of any sample of size 50 is The z-score that locates the mean number of seats in the Delaware tourism board's sample (M = 103.4) in the distribution of sample means is Use the unit normal tables and accompanying figures to answer the question that follows. To use the tables, select the desired range of z-score values. A table of the proportions of the normal distribution corresponding to that range of z-scores will appear.

Glencoe Algebra 1, Student Edition, 9780079039897, 0079039898, 2018
18th Edition
ISBN:9780079039897
Author:Carter
Publisher:Carter
Chapter10: Statistics
Section10.4: Distributions Of Data
Problem 19PFA

Related questions
Question
Transcribed Image Text:.08
.5319
.4681
.0319
.09
.5359
.4641
.0359
.10
.5398
.4602
.0398
.11
.5438
.4562
.0438
.12
.5478
.4522
.0478
.13
.5517
.4483
.0517
.14
.5557
.4443
.0557
.15
.5596
.4404
.0596
.16
.5636
.4364
.0636
.17
.5675
.4325
.0675
.18
.5714
.4286
.0714
.19
.5753
.4247
.0753
.20
.5793
.4207
.0793
.21
.5832
.4168
.0832
.22
.5871
.4129
.0871
.23
.5910
.4090
.0910
.24
.5948
.4052
.0948
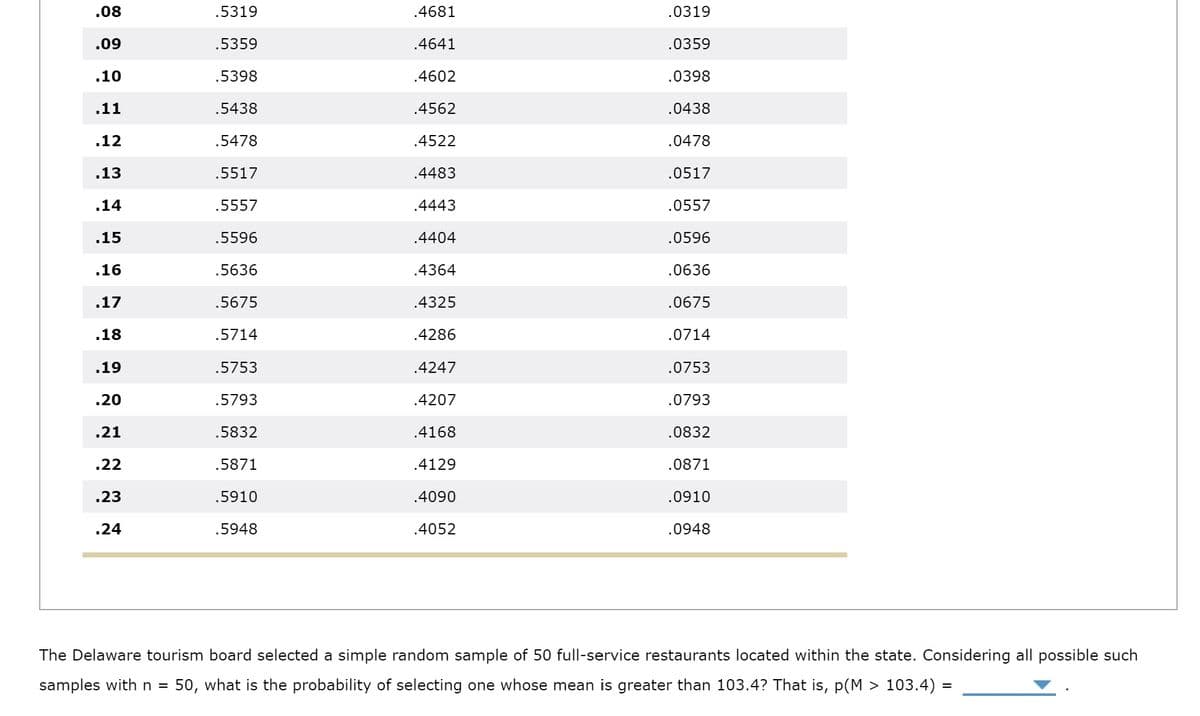
The Delaware tourism board selected a simple random sample of 50 full-service restaurants located within the state. Considering all possible such
samples with n =
50, what is the probability of selecting one whose mean is greater than 103.4? That is, p(M > 103.4) =
![6. Three different distributions
There are 559 full-service restaurants in Delaware. The mean number of seats per restaurant is 99.2. [Source: Data based on the 2002 Economic
Census from the US Census Bureau.]
Suppose that the true population meanu = 99.2 and standard deviation o = 20.8 are unknown to the Delaware tourism board. They select a simple
random sample of 50 full-service restaurants located within the state to estimate u. The mean number of seats per restaurant in the sample is M =
103.4, with a sample standard deviation of s = 18.2.
The standard deviation of the distribution of sample means (that is, the standard error, ƠM) is 2.94 ▼
(Note: Although u and o are unknown to
the Delaware tourism board, they are known to you for the purposes of calculating these answers.)
The standard or typical average difference between the mean number of seats in the 559 full-service restaurants in Delaware (µ = 99.2) and one
randomly selected full-service restaurant in Delaware is 2.94
The standard or typical average difference between the mean number of seats in the sample of 50 restaurants (M
103.4) and one randomly
selected restaurant in that sample is
The
tandard or typical average difference between the mean number of seats in th
559 full-service restaurants
Delaware (u = 99.2) and
sample mean of any sample of size 50 is
The z-score that locates the mean number of seats in the Delaware tourism board's sample (M
103.4) in the distribution of sample means is
Use the unit normal tables and accompanying figures to answer the question that follows. To use the tables, select the desired range of z-score values.
A table of the proportions of the normal distribution corresponding to that range of z-scores will appear.
Suggestion: Make a sketch of the area under the normal distribution you are seeking. This sketch will help you determine which column(s) of the
normal table to use in determining the appropriate probability.](/v2/_next/image?url=https%3A%2F%2Fcontent.bartleby.com%2Fqna-images%2Fquestion%2F472e43f8-20f8-4f72-9a4b-1c9773a66b40%2F5dfc1ac3-6276-4087-8318-01164e50f1af%2Fnwf9g8l_processed.jpeg&w=3840&q=75)
Transcribed Image Text:6. Three different distributions
There are 559 full-service restaurants in Delaware. The mean number of seats per restaurant is 99.2. [Source: Data based on the 2002 Economic
Census from the US Census Bureau.]
Suppose that the true population meanu = 99.2 and standard deviation o = 20.8 are unknown to the Delaware tourism board. They select a simple
random sample of 50 full-service restaurants located within the state to estimate u. The mean number of seats per restaurant in the sample is M =
103.4, with a sample standard deviation of s = 18.2.
The standard deviation of the distribution of sample means (that is, the standard error, ƠM) is 2.94 ▼
(Note: Although u and o are unknown to
the Delaware tourism board, they are known to you for the purposes of calculating these answers.)
The standard or typical average difference between the mean number of seats in the 559 full-service restaurants in Delaware (µ = 99.2) and one
randomly selected full-service restaurant in Delaware is 2.94
The standard or typical average difference between the mean number of seats in the sample of 50 restaurants (M
103.4) and one randomly
selected restaurant in that sample is
The
tandard or typical average difference between the mean number of seats in th
559 full-service restaurants
Delaware (u = 99.2) and
sample mean of any sample of size 50 is
The z-score that locates the mean number of seats in the Delaware tourism board's sample (M
103.4) in the distribution of sample means is
Use the unit normal tables and accompanying figures to answer the question that follows. To use the tables, select the desired range of z-score values.
A table of the proportions of the normal distribution corresponding to that range of z-scores will appear.
Suggestion: Make a sketch of the area under the normal distribution you are seeking. This sketch will help you determine which column(s) of the
normal table to use in determining the appropriate probability.
Expert Solution
This question has been solved!
Explore an expertly crafted, step-by-step solution for a thorough understanding of key concepts.

This is a popular solution!

Trending now
This is a popular solution!

Step by step
Solved in 2 steps with 1 images

Recommended textbooks for you
Glencoe Algebra 1, Student Edition, 9780079039897…
Algebra
ISBN:
9780079039897
Author:
Carter
Publisher:
McGraw Hill
Glencoe Algebra 1, Student Edition, 9780079039897…
Algebra
ISBN:
9780079039897
Author:
Carter
Publisher:
McGraw Hill