Suppose that winter starts and the weather turns sharply colder. (a) Is demand or supply affected? (b) In which direction does demand or supply shift? Briefly explain. (c) How does the equilibrium price and quantity change?


Q: al The dernand and supply schedules for wine are above. Plot both in a graph. Find the equilibrium…
A: a) As shown in diagram the downward sloping curve D is demand curve and upward sloping curve S is…
Q: Use the table below to choose the correct answer. The table is a schedule of the supply and demand…
A: Equilibrium price will occur at where the quantity demanded and quantity supplied intersects each…
Q: The graph shows the supply and demand curves for a certain product, which has a current selling…
A: The Law of Demand states that at a higher price the consumer will demand less of a good and vice…
Q: 3. Ellie sells seashell necklaces at $7 a necklace and currently has enough supply to meet demand.…
A: When the quantity demand is less than the quantity supplied, there will be surplus for the goods in…
Q: 4. Market research has revealed the following information about the market for chocolate bars.…
A: Equilibrium is achieved at a point where demand curve intersects the supply curve.
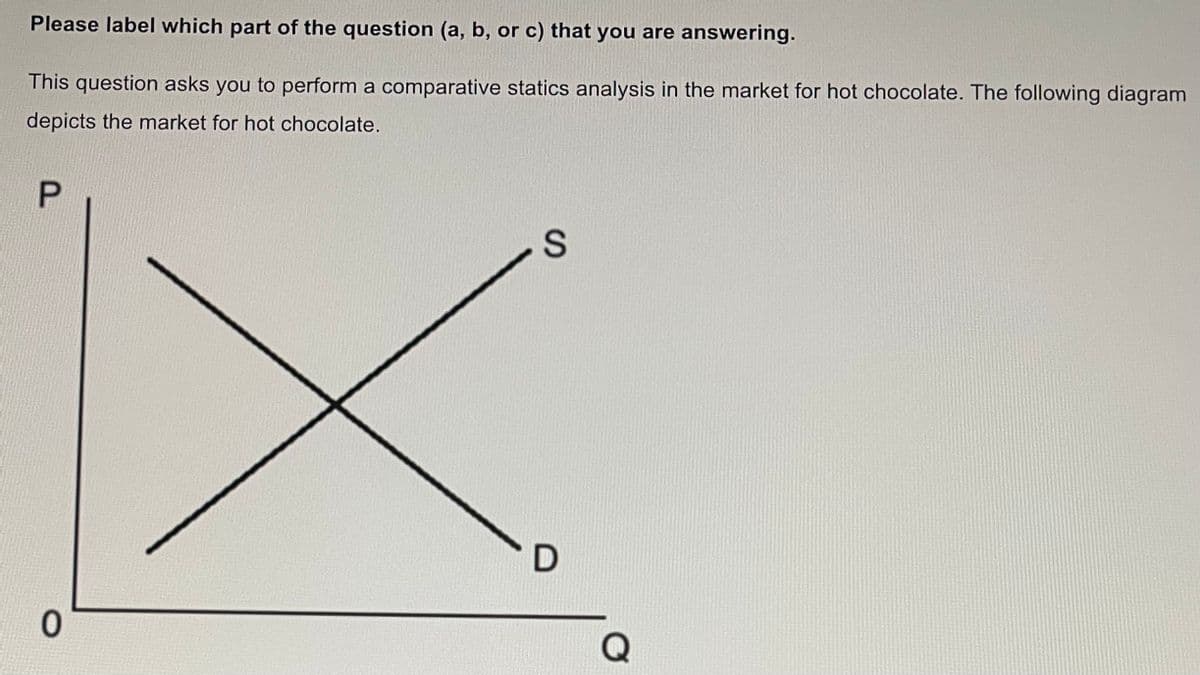
Q: Suppose we are analyzing the market for hot chocolate. Graphically illustrate the impact each of…
A: Hello, thank you for the question. Since there are multiple sub-part questions asked here, only the…
Q: Draw the supply and demand graph in equilibrium for a single market. Identify the equilibrium price…
A: In the free market, the equilibrium price and equilibrium quantity is determined by the forces of…
Q: a) Draw the lines of supply and demand curves in a graph b) Show the equilibrium point in the graph…
A: Hi! thanks for the question but as per the guidelines, we answer up to 3 subparts at one time.…
Q: Suppose we are analyzing the market for hot chocolate. Graphically illustrate the impact each of…
A: g.) When the price of milk increases, then the price of input to making a hot chocolate also…
Q: Part III: Changes in Equilibrium (Supply Curve Changes) Cups of Coffee $6 $5 $4 $3 -Demand $2…
A: Equilibrium is established where demand and supply intersect each other.
Q: Carefully explain what is happening in the following markets. Indicate the impact if any on demand,…
A: The concept that explains the interaction between the buyers for the resource and sellers of a…
Q: Directions: Plot the following hypothetical market demand and supply schedules for commodity Y and…
A: The law of demand states that there is an inverse relationship between price and quantity demanded.…
Q: Suppose we are analyzing the market for hot chocolate. Graphically illustrate the impact the…
A: The equilibrium price is known as the prevailing market price. The equilibrium price arises at the…
Q: What are the supply schedule and the supply curve, and how are they related? Why does the supply…
A: Supply Schedule is a tabulated representation of prices and quantity supplied by the individual firm…
Q: Q: (2) a) Graph a situation where the demand of a good increases faster than the supply for the…
A: Note: We’ll answer the first question since the exact one wasn’t specified. Please submit a new…
Q: How does one analyze a market where both demand and supply shift?
A:
Q: 1. The table below shows the quantity demanded and quantity supplied of wheat at various prices.…
A: Different levels of quantity demanded and supplied of wheat are explained at a different price level…
Q: II. Graphing Exercise. Provided with the following demand and supply schedule, plot a line graph…
A: The demand curve shows the willingness to pay of the consumers for different quantities of a good.…
Q: Taptops table ow use these data to analyze the situation in the market for laptops in that country.…
A:
Q: 1. Illustrate: a. The quantity demanded increases. b. The demand increases. с. The quantity demanded…
A:
Q: Suppose we are analyzing the market for hot chocolate. Graphically illustrate the impact the…
A: when the producer of hot chocolate expect the prices of hot chocolate to rise in future, they will…
Q: 3. A recent study found that the demand and supply sche- dules for frisbees are as follows: Price…
A: We know equilibrium occurs in the market when quantity demanded is equal to quantity supplied. From…
Q: Draw a diagram that shows a larger increase in demand than the decrease in supply.
A: Demand is the total quantity demanded by the customers of goods and services in the market.
Q: 1. Explain the law of demand and the law of supply, and through a diagram or a detailed…
A: Law of Demand: The law of demand says that the quantity demanded and the price are two determinants…
Q: In the market of Product "K". Assume Product "K" is an inferior good. If consumers' income decrease,…
A: A kind of good whose demand decreases as income increases is known as an inferior good. In other…
Q: The population of a City increased from 50000 to 80000 , use a diagram to illustrate the effect of…
A: please find the answer below.
Q: Price 10 20 30 40 50 60 a. Plot the demand and supply curve in the same diagram and show the…
A: Demand is the willingness and ability of consumers for consuming and buying goods and services at…
Q: Do you agree or disagree with each of the following statements? Briefly explain your answers and…
A: The movement along the dd curve occurs when the prices variate for a good, and other factors such as…
Q: Once again, consider the market for avocados. Approximately 32 percent of the world's total…
A: Devastating wildfires destroy large swaths of California's avocado crop. This would result in…
Q: The market for pizza has the following demand and supply schedules: (see the attached table) a.…
A: The market equilibrium is the condition where both economic forces like demand and supply curve…
Q: Suppose the Hong Kong government imposes a price ceiling above the equilibrium price of flour. How…
A: The price ceiling is a strategy to stop the price from rising above a specific level. It comes under…
Q: What causes the market demand for a commodity to increase (i.e., causes the market demand curve to…
A: As economies and societies developed, the study of economics got more complicated. Hence, as a…
Q: Suppose that Maine lobsters can be sold only in the United States. The U.S. demand schedule for…
A: Equilibrium Point: The equilibrium point is the point that is determined by the intersection of…
Q: Use supply and demand curves to illustrate how each of the following changes will affect the…
A: "Since you have posted a question with multiple subparts, we will solve the first three subparts for…
Q: Suppose a market is initially in equilibrium. Then a change occurs and the equilibrium price…
A: The markets are operated by the buyers, and sellers in the market, where both the buyers, and…
Q: Question The market for disposal digital cameras has the following demand and supply schedules:…
A: Equilibrium is achieved at the output level where Qs=Qd
Q: 1. The following headline appeared in the London Times, "England's sheep population nearly destroyed…
A: Ss(supply) curve is a positively curved line which shows the direct relation between P(price) and…
Q: 1. The table below shows the quantity demanded and quantity supplied of wheat at various prices.…
A: In an economy, the demand and supply schedule helps to understand the market condition better as it…
Q: Question: Consider a market for Ice Cream an inferior good in Pakistan. For each of the given…
A: 1) News reports claim that the consumption of Ice Cream is good for the health of coronavirus…
Q: Illustrate by graph the equilibrium point in the market, then find the following: (Notes that you…
A: The interaction of the forces of demand and supply determines the equilibrium price and quantity of…
Q: Carefully explain what is happening in the following market. Indicate the impact if any on demand,…
A: Demand for a good is defined by what a consumer is willing to pay for his choice of consumption good…
Q: When the price is above the equilibrium, explain how market forces move me market price to…
A: Equilibrium is achieved when quantity demanded equals quantity supplied.
Q: How is the price of gasoline determined in a competitive market? What predictions can you make about…
A: A competitive market is a market where a large number of buyers and sellers. In this market firms…
Q: Recent wildfires in northern California have destroyed much of the vineyards and grapes from which…
A: The demand for a quantity(Qd) depends upon the price of that quantity and also on other factors such…
Q: Problem one (from Farnham, 2014) Suppose the demand and supply curves for a product is given by Q =…
A: Note:- Since we can only answer up to three subparts, we'll answer the first three. Please repost…
Q: Please explain what happens in a market when the price of the product decreases relative to its…
A: In a market, an equilibrium level can be expressed on a graph as it is the intersection point of…
Q: List give factors that would influence the supply of sugar (indicate increase or decrease in supply…
A: Supply is the amount of commodity the producer is willing and able to sell at a particular price. In…


Trending now
This is a popular solution!

Step by step
Solved in 2 steps with 1 images


- The following graph shows the annual market for Florida oranges, which are sold in units of 90-pound boxes. Use the graph input tool to help you answer the following questions. You will not be graded on any changes you make to this graph. Note: Once you enter a value in a white field, the graph and any corresponding amounts in each grey field will change accordingly. 07014021028035042049056063070050454035302520151050PRICE (Dollars per box)QUANTITY (Millions of boxes)Demand Supply Graph Input Tool Market for Florida Oranges Price (Dollars per box) Quantity Demanded (Millions of boxes) Quantity Supplied (Millions of boxes) In this market, the equilibrium price is per box, and the equilibrium quantity of oranges is million boxes. For each of the prices listed in the following table, determine the quantity of oranges demanded, the quantity of oranges supplied, and the direction of pressure exerted on prices…Subject: Manegerial Economics & Policy The maker of a leading brand of low-calorie microwavable food estimated the following demand equation for its product using data from 26 supermarkets around the country for the month of April: Q = -5,200 - 42P + 20PX + 5.2l + 0.20A + 0.25M (2.002) (17.5) (6.2) (2.5) (0.09) (0.21) R2 = 0.55 n = 26 F = 4.88 Assume the following values for the independent variables: Q = Quantity sold per month P (in cents) = Price of the product = 500 PX (in cents) = Price of leading competitor’s product = 600 I (in dollars) = Per capita income of the standard metropolitan statistical area (SMSA) in which the supermarket is located = 5,500 A (in dollars) = Monthly advertising expenditure = 10,000 M = Number of microwave ovens sold in the SMSA in which the supermarket is located = 5,000 Using this information, answer the following questions: Compute elasticities for each variable. Do you think that this firm should cut its price to increase its market…Subject: Manegerial Economics & Policy The maker of a leading brand of low-calorie microwavable food estimated the following demand equation for its product using data from 26 supermarkets around the country for the month of April: Q = -5,200 - 42P + 20PX + 5.2l + 0.20A + 0.25M (2.002) (17.5) (6.2) (2.5) (0.09) (0.21) R2 = 0.55 n = 26 F = 4.88 Assume the following values for the independent variables: Q = Quantity sold per month P (in cents) = Price of the product = 500 PX (in cents) = Price of leading competitor’s product = 600 I (in dollars) = Per capita income of the standard metropolitan statistical area (SMSA) in which the supermarket is located = 5,500 A (in dollars) = Monthly advertising expenditure = 10,000 M = Number of microwave ovens sold in the SMSA in which the supermarket is located = 5,000 Using this information, answer the following questions: (remaining parts) Interpret your results for each variable. What proportion of the variation in sales is explained by the…
- Subject: Manegerial Economics & Policy The maker of a leading brand of low-calorie microwavable food estimated the following demand equation for its product using data from 26 supermarkets around the country for the month of April: Q = -5,200 - 42P + 20PX + 5.2l + 0.20A + 0.25M (2.002) (17.5) (6.2) (2.5) (0.09) (0.21) R2 = 0.55 n = 26 F = 4.88 Assume the following values for the independent variables: Q = Quantity sold per month P (in cents) = Price of the product = 500 PX (in cents) = Price of leading competitor’s product = 600 I (in dollars) = Per capita income of the standard metropolitan statistical area (SMSA) in which the supermarket is located = 5,500 A (in dollars) = Monthly advertising expenditure = 10,000 M = Number of microwave ovens sold in the SMSA in which the supermarket is located = 5,000 Using this information, answer the following questions: (remaining parts) Do you think that this firm should cut its price to increase its market share/revenue? Explain. What…The following graph input tool shows the daily demand for hotel rooms at the Oceans Hotel and Casino in Atlantic City, New Jersey. To help the hotel management better understand the market, an economist identified three primary factors that affect the demand for rooms each night. These demand factors, along with the values corresponding to the initial demand curve, are shown in the following table and alongside the graph input tool. Demand FactorInitial ValueAverage American household income$50,000 per yearRoundtrip airfare from Pittsburgh (PIT) to Atlantic City (ACY)$250 per roundtripRoom rate at the Meadows Hotel and Casino, which is near the Oceans$250 per night For each of the following scenarios, begin by assuming that all demand factors are set to their original values and Oceans is charging $100 per room per night. If average household income increases by 20%, from $50,000 to $60,000 per year, the quantity of rooms demanded at the Oceans____ from rooms per night to______rooms…As an Economics student you have been analysing the price movements of differentproducts. You note the following two price relationships:a. When there is a drought the price of maize rises.b. When the price of potatoes increases, the price of bread also increases (bread is asubstitute for potatoes).Use demand and supply diagrams to explain these two relationships. Please note: Twodiagrams are required, one for maize and one for bread.
- The following graph shows the annual market for Michigan blueberries, which are sold in units of 50-pound boxes. Use the graph input tool to help you answer the following questions. You will not be graded on any changes you make to this graph. Note: Once you enter a value in a white field, the graph and any corresponding amounts in each grey field will change accordingly. 08016024032040048056064072080050454035302520151050PRICE (Dollars per box)QUANTITY (Millions of boxes)Demand Supply Graph Input Tool Market for Michigan Blueberries Price (Dollars per box) Quantity Demanded (Millions of boxes) Quantity Supplied (Millions of boxes) In this market, the equilibrium price is per box, and the equilibrium quantity of blueberries is million boxes. For each of the prices listed in the following table, determine the quantity of blueberries demanded, the quantity of blueberries supplied, and the direction of pressure…There is a functional relationship between Price of an IPod Touch, � and Weekly Demand,The market for all lawn care equipment shipped annually in the United States is approximately $16 billion, according to the Outdoor Power Equipment Institute, a trade organization based in Alexandria, Va. Most of it is bought by homeowners, and their choices are changing. For example, while gas-power mowers still dominate sales, “the speed at which battery-powered alternatives are gaining ground is notable,” said Grant Farnsworth, the president of the market research firm Farnsworth Group. Within the last four years, sales of battery push mowers have increased from 4 to 8 percent, he said. Use supply and demand graphs to analyze what will happen in the market for gas- powered lawn equipment and the market for battery/electric/robotic lawn equipment. Explain what shifts, and what happens to prices and quantities. How do elasticities of demand and elasticities of supply affect your answers to #1 What will happen to the productivity of lawn-care workers after the transition? At what…
- If no trade occurs between the markets, what are the equilibrium values of D1, S1, P1, D2, S2, and P2? Solve algebraically question number 1 that is picturedDiscuss in detail the effects of the following factors on the position of IS curve - 4-Taxes; 5-technology;Part 1: Spatial Equilibrium The demand in market 1 is D1 = 24 - P1 The supply in market 1 is S1 = -2 + P1 The demand in market 2 is D2 = 16 - P2 The supply in market 2 is S2 = 2 + P2 If no trade occurs between the markets, what are the equilibrium values of D1, S1, P1, D2, S2, and P2? Solve algebraically. If the cost of transportation between the two markets is PT = 2, what would be the equilibrium values of D1, S1, P1, D2, S2, P2, QT, and PT? Solve algebraically. Show the above situation graphically, both with and without trade.Please label everything. [Insert an image of your graph here]


