Suppose that you are offered the following "deal." You roll a six sided die. If you roll a 6, you win $6. If you roll a 3, 4 or 5, you win $2. Otherwise, you pay $6. a. Complete the PDF Table. List the X values, where X is the profit, from smallest to largest. Round to 4 decimal places where appropriate. Probability Distribution Table P(X) b. Find the expected profit. $ (Round to the nearest cent) c. Interpret the expected value. O You will win this much if you play a game. O This is the most likely amount of money you will win. O If you play many games you will likely break close to even. d. Based on the expected value, should you play this game? O Yes, because you can win $6.00 which is greater than the $6.00 that you can lose. O No, since the expected value is negative, you would be very likely to come home with less money if you played many games.
Suppose that you are offered the following "deal." You roll a six sided die. If you roll a 6, you win $6. If you roll a 3, 4 or 5, you win $2. Otherwise, you pay $6. a. Complete the PDF Table. List the X values, where X is the profit, from smallest to largest. Round to 4 decimal places where appropriate. Probability Distribution Table P(X) b. Find the expected profit. $ (Round to the nearest cent) c. Interpret the expected value. O You will win this much if you play a game. O This is the most likely amount of money you will win. O If you play many games you will likely break close to even. d. Based on the expected value, should you play this game? O Yes, because you can win $6.00 which is greater than the $6.00 that you can lose. O No, since the expected value is negative, you would be very likely to come home with less money if you played many games.

Chapter8: Sequences, Series,and Probability
Section: Chapter Questions
Problem 41CT: On a game show, a contestant is given the digits 3, 4, and 5 to arrange in the proper order to form...

Related questions

Concept explainers
Contingency Table
A contingency table can be defined as the visual representation of the relationship between two or more categorical variables that can be evaluated and registered. It is a categorical version of the scatterplot, which is used to investigate the linear relationship between two variables. A contingency table is indeed a type of frequency distribution table that displays two variables at the same time.
Binomial Distribution
Binomial is an algebraic expression of the sum or the difference of two terms. Before knowing about binomial distribution, we must know about the binomial theorem.
Topic Video
Question
11
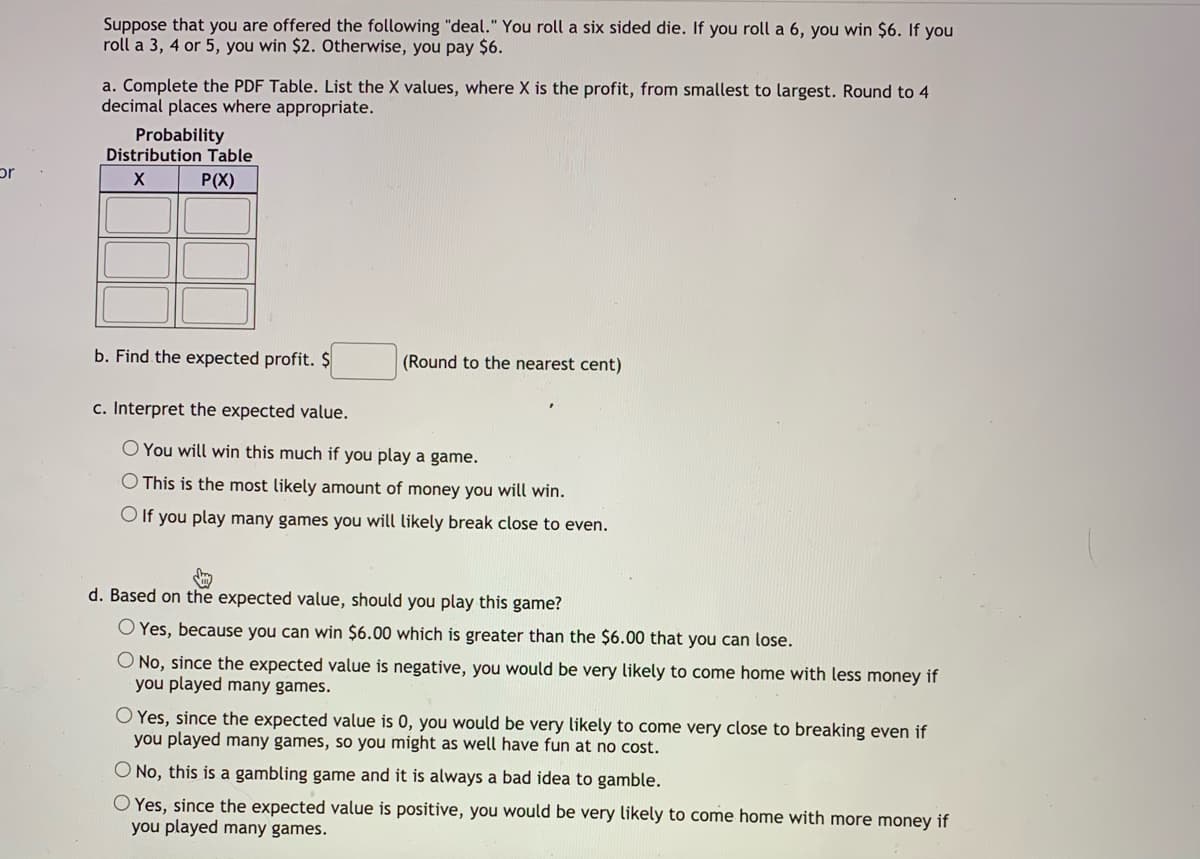
Transcribed Image Text:Suppose that you are offered the following "deal." You roll a six sided die. If you roll a 6, you win $6. If you
roll a 3, 4 or 5, you win $2. Otherwise, you pay $6.
a. Complete the PDF Table. List the X values, where X is the profit, from smallest to largest. Round to 4
decimal places where appropriate.
Probability
Distribution Table
pr
P(X)
b. Find the expected profit. $
(Round to the nearest cent)
c. Interpret the expected value.
You will win this much if you play a game.
O This is the most likely amount of money you will win.
O If you play many games you will likely break close to even.
d. Based on the expected value, should you play this game?
O Yes, because you can win $6.00 which is greater than the $6.00 that you can lose.
O No, since the expected value is negative, you would be very likely to come home with less money if
you played many games.
O Yes, since the expected value is 0, you would be very likely to come very close to breaking even if
you played many games, so you might as well have fun at no cost.
O No, this is a gambling game and it is always a bad idea to gamble.
O Yes, since the expected value is positive, you would be very likely to come home with more money if
you played many games.
Expert Solution
This question has been solved!
Explore an expertly crafted, step-by-step solution for a thorough understanding of key concepts.

Step by step
Solved in 3 steps

Knowledge Booster


Learn more about
Need a deep-dive on the concept behind this application? Look no further. Learn more about this topic, statistics and related others by exploring similar questions and additional content below.Recommended textbooks for you

Holt Mcdougal Larson Pre-algebra: Student Edition…
Algebra
ISBN:
9780547587776
Author:
HOLT MCDOUGAL
Publisher:
HOLT MCDOUGAL

College Algebra (MindTap Course List)
Algebra
ISBN:
9781305652231
Author:
R. David Gustafson, Jeff Hughes
Publisher:
Cengage Learning
Holt Mcdougal Larson Pre-algebra: Student Edition…
Algebra
ISBN:
9780547587776
Author:
HOLT MCDOUGAL
Publisher:
HOLT MCDOUGAL
College Algebra (MindTap Course List)
Algebra
ISBN:
9781305652231
Author:
R. David Gustafson, Jeff Hughes
Publisher:
Cengage Learning