Suppose the federal funds rate is not close to zero, risk spreads are roughly constant so that different interest rates rise and fall together, and banks are not holding many excess reserves. Federal Reserve open-market operations are done mostly in Treasury bills. Such economic conditions are referred to as “normal times.” Suppose the Federal Reserve implements an expansionary monetary policy by ________(BUYING /SELLING) bonds through open-market operations. IST GRAPH The following graph shows the demand and supply of bank reserves. On the graph, show the effect of the Fed's expansionary monetary policy by shifting one or both of the curves. Note: Select and drag one or both of the curves to the desired position. Curves will snap into position, so if you try to move a curve and it snaps back to its original
Suppose the federal funds rate is not close to zero, risk spreads are roughly constant so that different interest rates rise and fall together, and banks are not holding many excess reserves. Federal Reserve open-market operations are done mostly in Treasury bills. Such economic conditions are referred to as “normal times.” Suppose the Federal Reserve implements an expansionary monetary policy by ________(BUYING /SELLING) bonds through open-market operations. IST GRAPH The following graph shows the demand and supply of bank reserves. On the graph, show the effect of the Fed's expansionary monetary policy by shifting one or both of the curves. Note: Select and drag one or both of the curves to the desired position. Curves will snap into position, so if you try to move a curve and it snaps back to its original

Chapter12: Money And Banking
Section: Chapter Questions
Problem 10E

Related questions
Question
100%
Monetary policy and the market for bank reserves
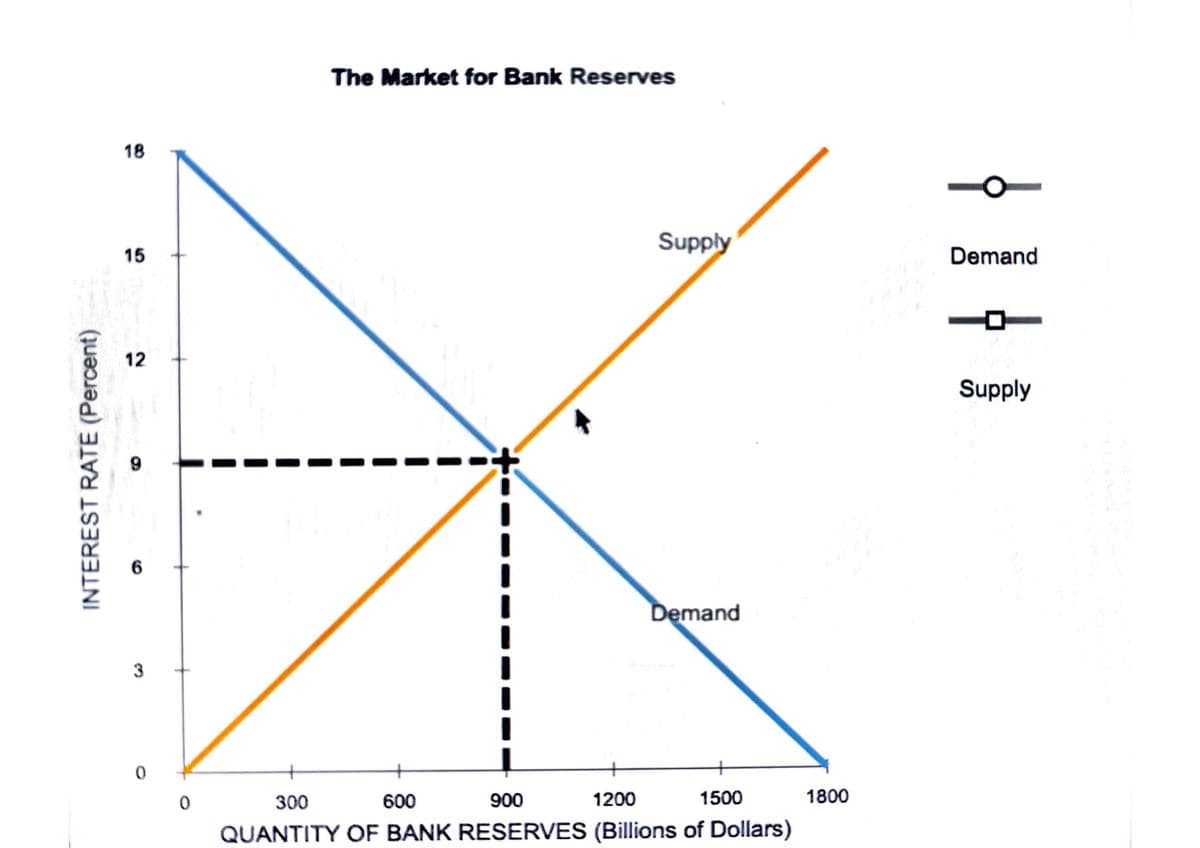
Suppose the federal funds rate is not close to zero, risk spreads are roughly constant so that different interest rates rise and fall together, and banks are not holding many excess reserves . Federal Reserve open-market operations are done mostly in Treasury bills. Such economic conditions are referred to as “normal times.”
Suppose the Federal Reserve implements an expansionary monetary policy by ________(BUYING /SELLING) bonds through open-market operations.
IST GRAPH The following graph shows the demand and supply of bank reserves.
On the graph, show the effect of the Fed's expansionary monetary policy by shifting one or both of the curves.
Note: Select and drag one or both of the curves to the desired position. Curves will snap into position, so if you try to move a curve and it snaps back to its original position, just drags it a little farther.
As a result of the Fed's expansionary policy, the interest rate _______________(RISES/FALLS) _____% .
2ND GRAPH 2ND SUBPART
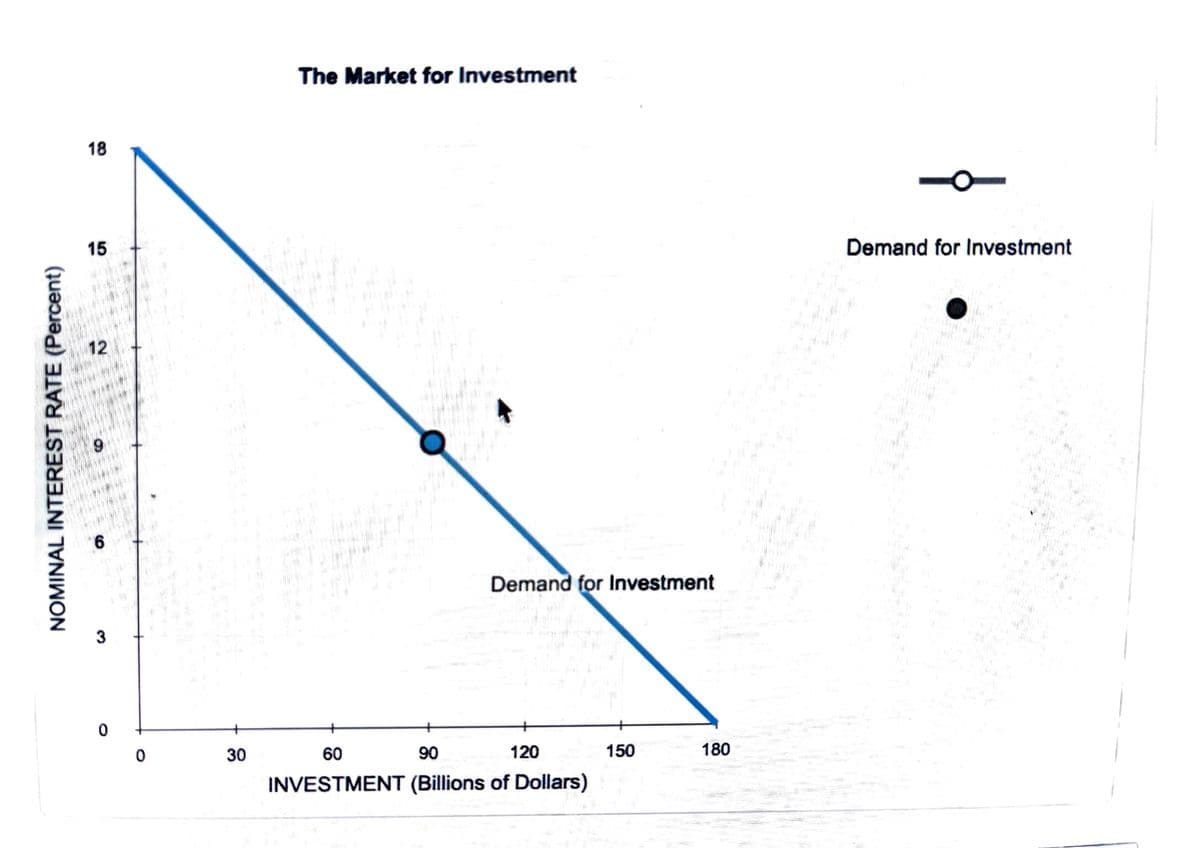
Investment is one component of total spending. The following graph shows the demand for investment.
Use the information from the previous graph to show the short-run effect of the Fed's expansionary monetary policy by shifting the demand curve or moving the point along the curve on the following graph.
Hint: Be sure the new interest rate corresponds to the interest rate you found in the previous graph.
As a result of the Fed's expansionary policy, the quantity of investment demanded ___(RISES/FALLS) to $_________Billion.
Note - this one question is divided into subparts . please answer the subparts also.
Transcribed Image Text:INTEREST RATE (Percent)
18
15
12
9
6
3
0
The Market for Bank Reserves
Supply
Demand
0
300
600
900
1200
1500
QUANTITY OF BANK RESERVES (Billions of Dollars)
1800
Demand
Supply
Transcribed Image Text:NOMINAL INTEREST RATE (Percent)
18
15
12
9
6
3
0
0
30
The Market for Investment
g
Demand for Investment
60
90
120
150
180
INVESTMENT (Billions of Dollars)
Demand for Investment
Expert Solution
This question has been solved!
Explore an expertly crafted, step-by-step solution for a thorough understanding of key concepts.

This is a popular solution!

Trending now
This is a popular solution!

Step by step
Solved in 3 steps with 1 images

Knowledge Booster


Learn more about
Need a deep-dive on the concept behind this application? Look no further. Learn more about this topic, economics and related others by exploring similar questions and additional content below.Recommended textbooks for you