
MATLAB: An Introduction with Applications
6th Edition
ISBN: 9781119256830
Author: Amos Gilat
Publisher: John Wiley & Sons Inc
expand_more
expand_more
format_list_bulleted
Question

Transcribed Image Text:
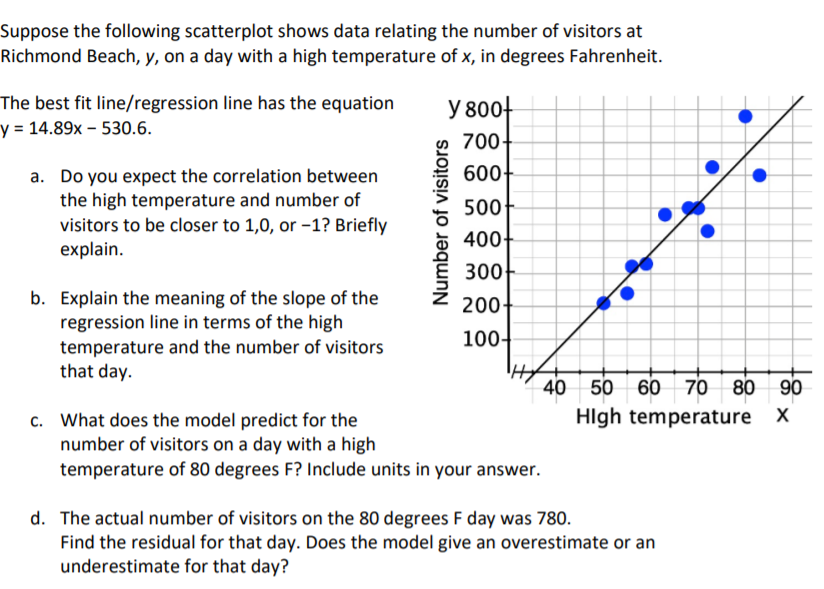
Suppose the following scatterplot shows data relating the number of visitors at
Richmond Beach, y, on a day with a high temperature of x, in degrees Fahrenheit.
Expert Solution

This question has been solved!
Explore an expertly crafted, step-by-step solution for a thorough understanding of key concepts.
This is a popular solution
Trending nowThis is a popular solution!
Step by stepSolved in 5 steps with 1 images

Knowledge Booster
Learn more about
Need a deep-dive on the concept behind this application? Look no further. Learn more about this topic, statistics and related others by exploring similar questions and additional content below.Similar questions
- Suppose a positive linear correlation is found between two quantities. Does this mean that one of the quantities increasing causes the other to increase? If not, what does it mean?arrow_forwardSuppose that there is a correlation of r = 0.41 between the amount of time that each student reports studying for an exam and the student's grade on the exam. This correlation would mean that there is a tendency for people who study more to get better grades. Question 21 options: True Falsearrow_forwardIt has been determined that there is a significant relationship between the temperature (x) and the number of times that a cricket chirps in a minute (y). Below is a table of values: Number of Temperature chirps 69.7 882 93.3 1188 84.3 1104 76.3 864 88.6 1200 82.6 1032 71.6 960 79.6 900arrow_forward
- A special education teacher did research on whether or not there is a relationship between the number of students in his class and the number incidents of “acting out” behaviors exhibited by the autistic students in the classroom. He collects data for a year and aggregates them by month. He obtained the statistics below, r= -.863 R2=.74 b= -1.212294 a= 131.176598 10.) How does the presence of more students affect the incidents in the class? a) as students are added the incidences increase b) as students are added the incidences decrease c) the number of students does not affect acting out d) the number of students caused more incidents How much of the variability of acting out is explained by the number of students in the class?___________arrow_forwardQ. 24 What is the difference between absolute and relative dispersion?arrow_forwardMatch the following scatterplots to their correct correlation coefficients (r). 1. r= -0.852. r= -0.403. r= 04. r= 0.505. r= 0.906. r= 0.99arrow_forward
- Fill the chi square for Cross 1 and Cross 2 from the following data in the attached image: Cross 1: Phenotypes Ratio Observed Expected (O-E)2/E Totals X2 = Cross 2: Phenotypes Ratio Observed Expected (O-E)2/E Totals X2 =arrow_forwardSuppose in a given problem about the correlation between height and weight of 20 college students, we come up with an r value of 0.93. What is the value of the coefficient of determination? a. 0.84b. 0.85c. 0.86d. 0.87arrow_forwardA chi square test tells us: a. Whether two continuous variables are correlated with each other. b. Whether two discrete variables are independent of each other c. The amount of variation in one variable explained by the other d. Which categories of one variable are associated with which categories of the other variablearrow_forward
- A sample of 20 ordered pairs (x,y) has a value for "r" of r = 0.485 Which of the following statements are true? At the 5% level of significance, a positive correlation exists At the 1% level of significance, a positive correlation exists At the 1% level of significance, a negative correlation exists At the 5% level of significance, a negative correlation existsarrow_forwardCreate a scatter diagram for this correlation with time on social networking sites along the x axisarrow_forward
arrow_back_ios
arrow_forward_ios
Recommended textbooks for you
- MATLAB: An Introduction with ApplicationsStatisticsISBN:9781119256830Author:Amos GilatPublisher:John Wiley & Sons IncProbability and Statistics for Engineering and th...StatisticsISBN:9781305251809Author:Jay L. DevorePublisher:Cengage LearningStatistics for The Behavioral Sciences (MindTap C...StatisticsISBN:9781305504912Author:Frederick J Gravetter, Larry B. WallnauPublisher:Cengage Learning
- Elementary Statistics: Picturing the World (7th E...StatisticsISBN:9780134683416Author:Ron Larson, Betsy FarberPublisher:PEARSONThe Basic Practice of StatisticsStatisticsISBN:9781319042578Author:David S. Moore, William I. Notz, Michael A. FlignerPublisher:W. H. FreemanIntroduction to the Practice of StatisticsStatisticsISBN:9781319013387Author:David S. Moore, George P. McCabe, Bruce A. CraigPublisher:W. H. Freeman

MATLAB: An Introduction with Applications
Statistics
ISBN:9781119256830
Author:Amos Gilat
Publisher:John Wiley & Sons Inc

Probability and Statistics for Engineering and th...
Statistics
ISBN:9781305251809
Author:Jay L. Devore
Publisher:Cengage Learning

Statistics for The Behavioral Sciences (MindTap C...
Statistics
ISBN:9781305504912
Author:Frederick J Gravetter, Larry B. Wallnau
Publisher:Cengage Learning

Elementary Statistics: Picturing the World (7th E...
Statistics
ISBN:9780134683416
Author:Ron Larson, Betsy Farber
Publisher:PEARSON

The Basic Practice of Statistics
Statistics
ISBN:9781319042578
Author:David S. Moore, William I. Notz, Michael A. Fligner
Publisher:W. H. Freeman

Introduction to the Practice of Statistics
Statistics
ISBN:9781319013387
Author:David S. Moore, George P. McCabe, Bruce A. Craig
Publisher:W. H. Freeman