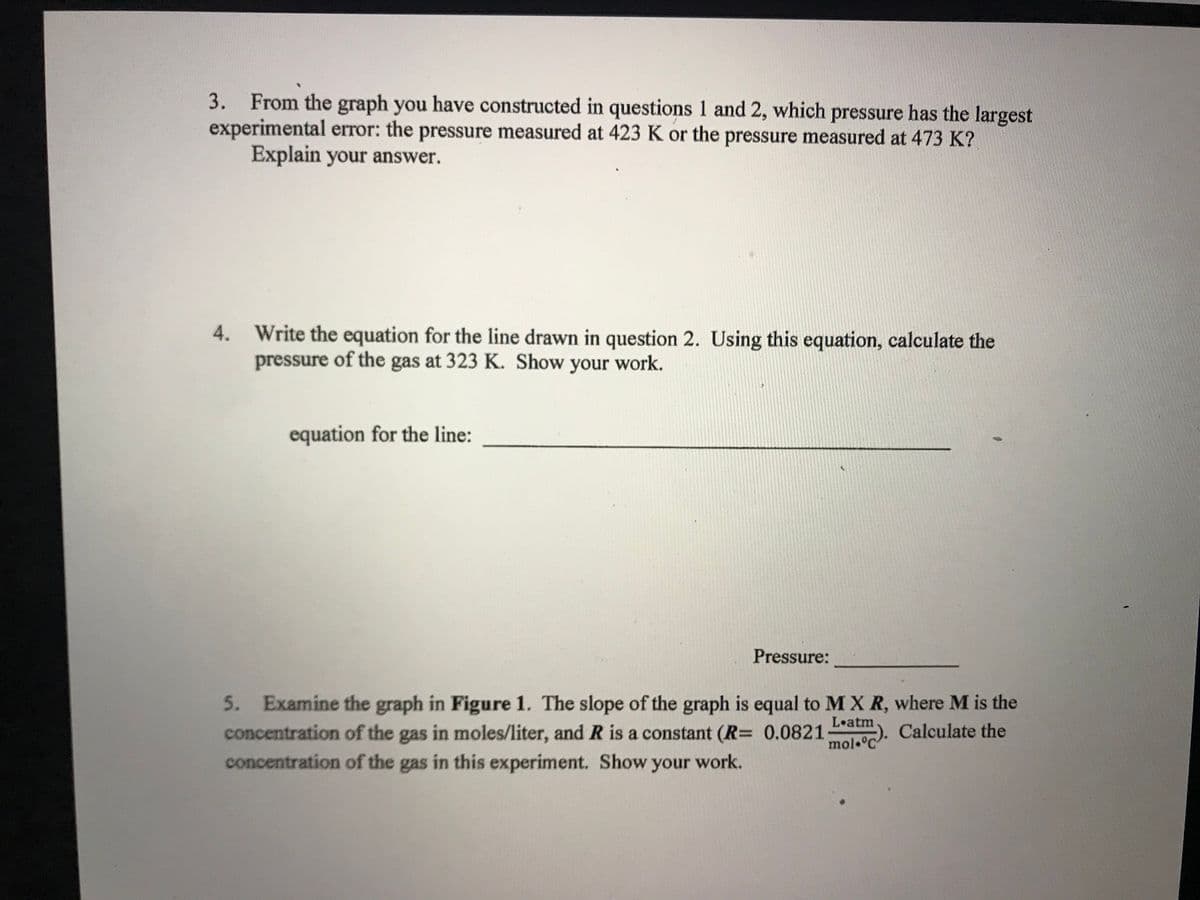
Plot the following data using proper graphing techniques. (Hint: P depends on T) Temperature (Kelvin) Pressure (atmospheres) 373 1.0127 398 1.0509 423 1.1017 448 1.1942 473 1.2446

Functions and Change: A Modeling Approach to College Algebra (MindTap Course List)
6th Edition
ISBN:9781337111348
Author:Bruce Crauder, Benny Evans, Alan Noell
Publisher:Bruce Crauder, Benny Evans, Alan Noell
Chapter3: Straight Lines And Linear Functions
Section3.3: Modeling Data With Linear Functions
Problem 15SBE
icon
Related questions
icon
Concept explainers
Topic Video
Question

How do I graph and solve this question?
Plot the following data using proper graphing techniques. (Hint: P depends on T)
Temperature (Kelvin)
Pressure (atmospheres)
373
1.0127
398
1.0509
423
1.1017
448
1.1942
473
1.2446
Transcribed Image Text:Plot the following data using proper graphing techniques. (Hint: P depends on T) Temperature (Kelvin) Pressure (atmospheres) 373 1.0127 398 1.0509 423 1.1017 448 1.1942 473 1.2446
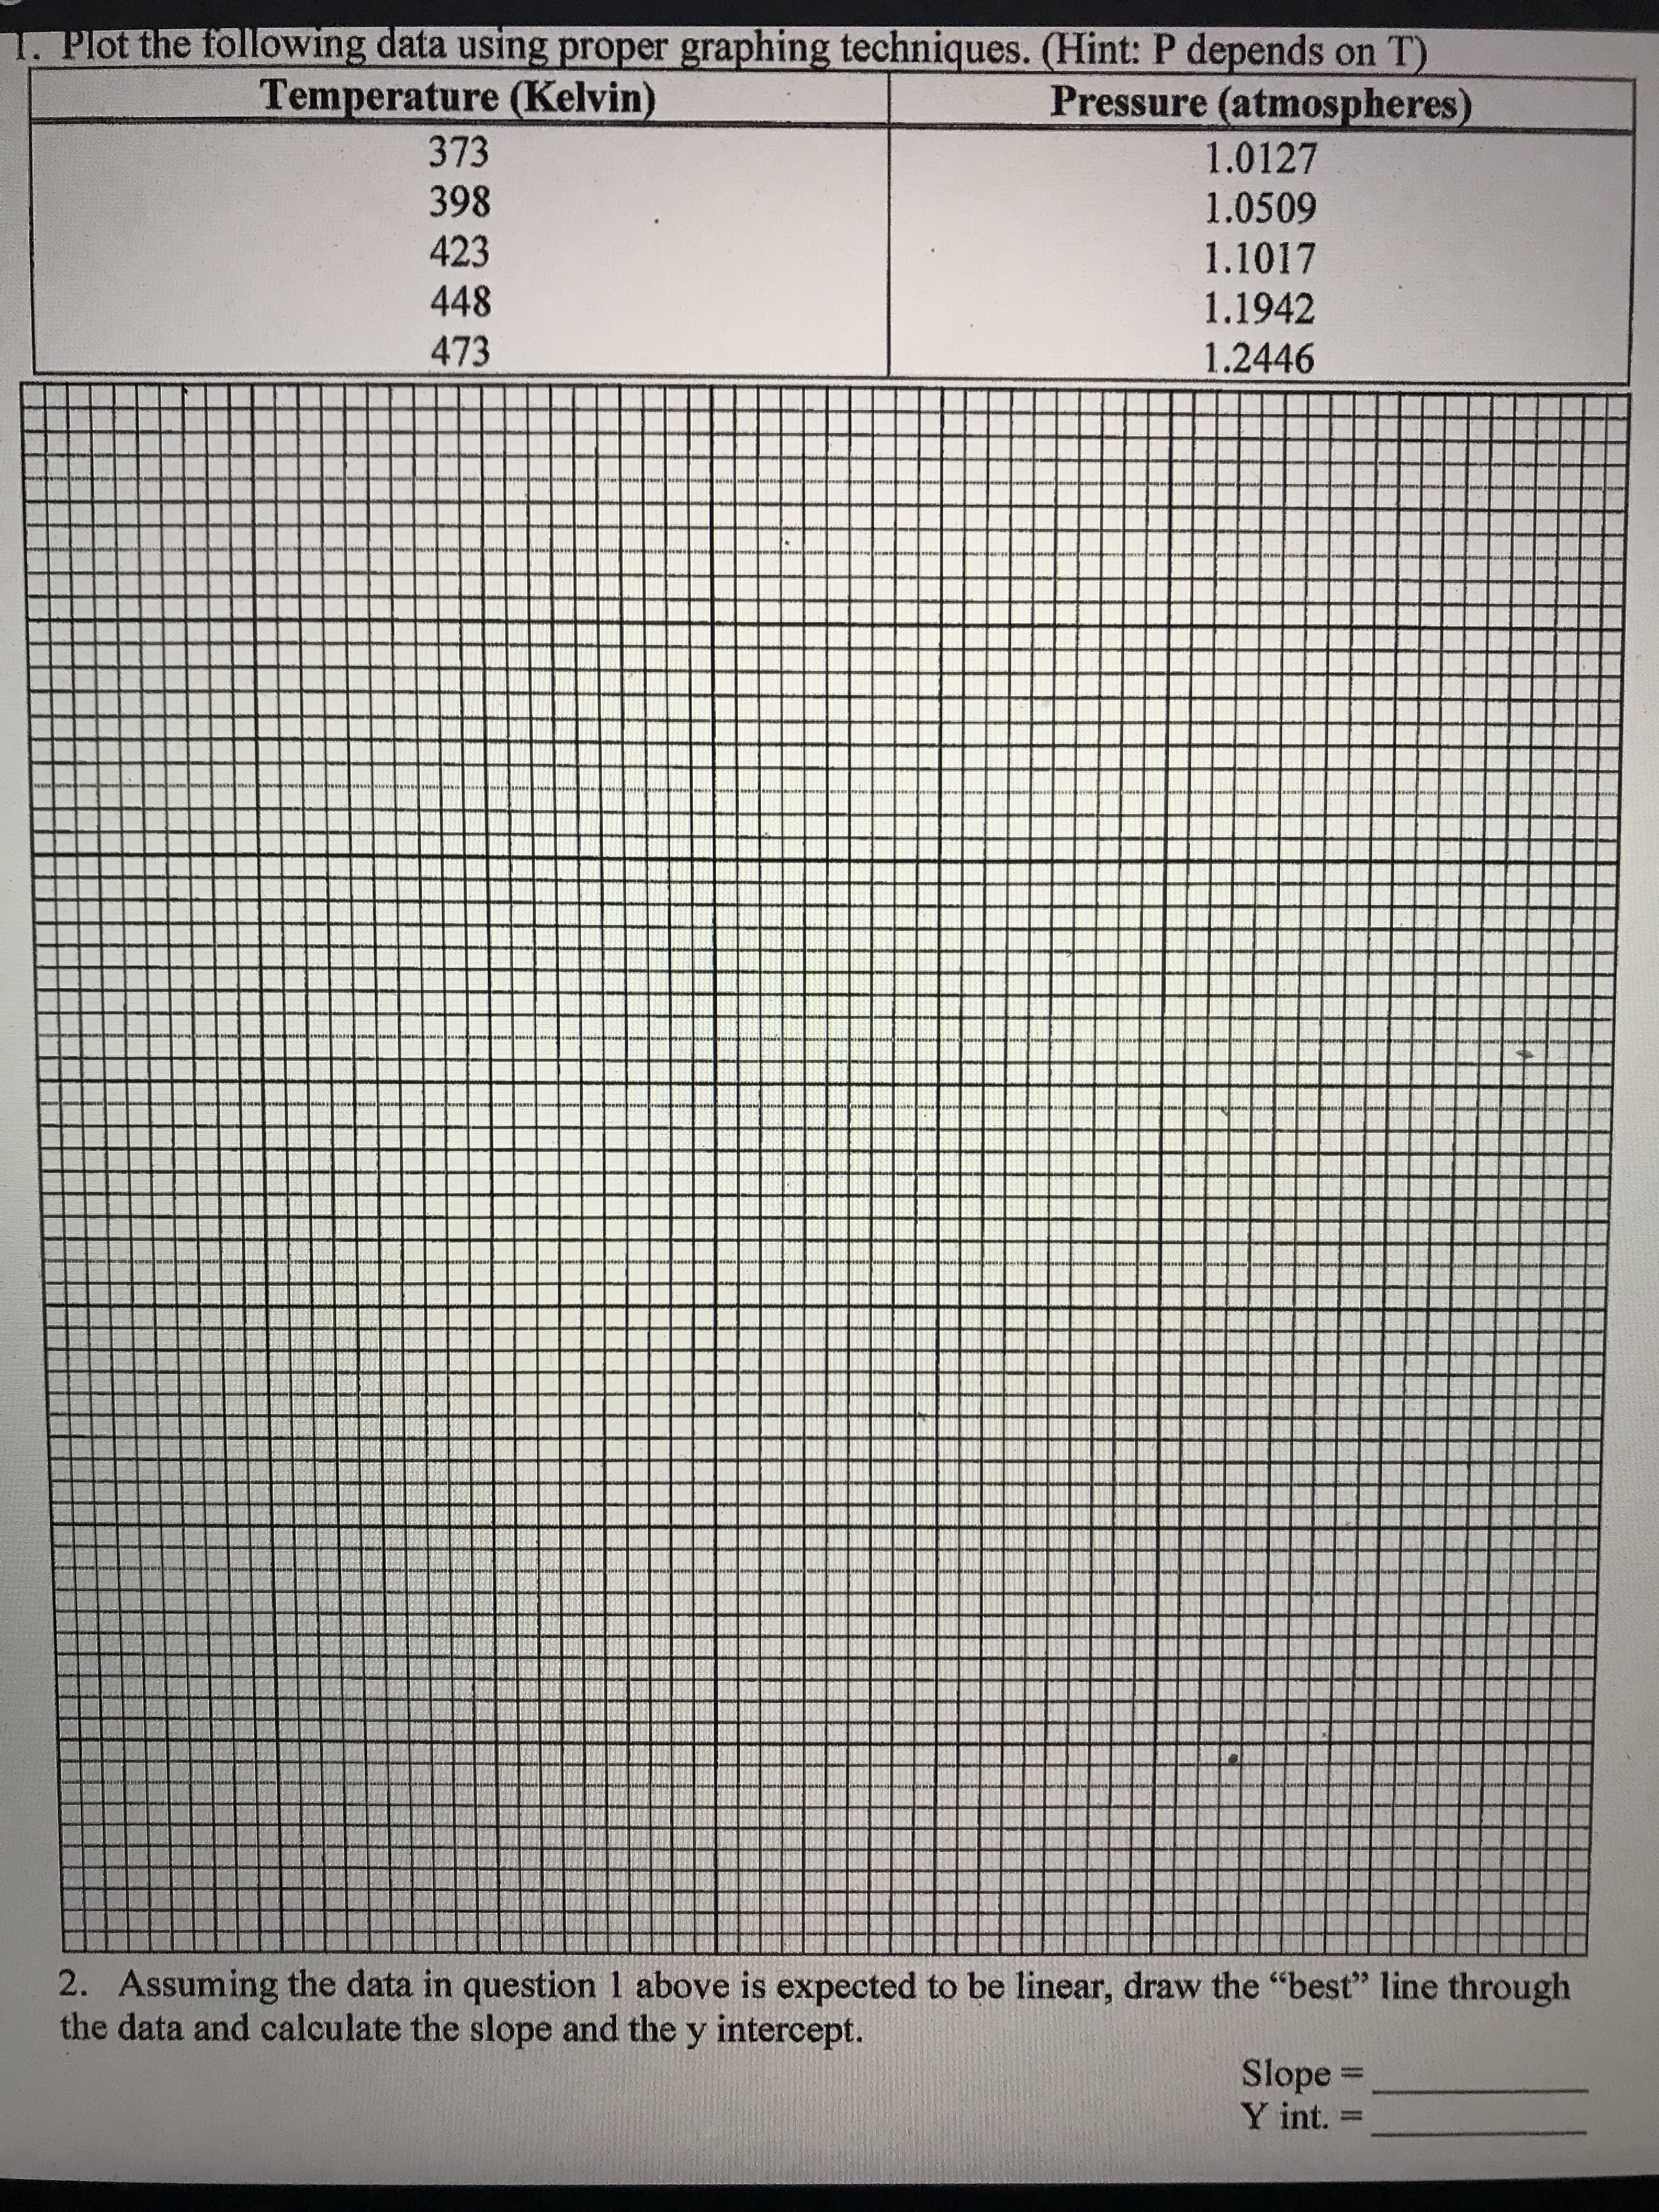
3. From the graph you have constructed in questions 1 and 2, which pressure has the largest
experimental error: the pressure measured at 423 K or the pressure measured at 473 K?
Explain your answer.
4. Write the equation for the line drawn in question 2. Using this equation, calculate the
pressure of the gas at 323 K. Show your work.
equation for the line:
Pressure:
5. Examine the graph in Figure 1. The slope of the graph is equal to M X R, where M is the
concentration of the gas in moles/liter, and R is a constant (R= 0.0821
concentration of the gas in this experiment. Show your work.
L atm
-). Calculate the
mol °C
Transcribed Image Text:3. From the graph you have constructed in questions 1 and 2, which pressure has the largest experimental error: the pressure measured at 423 K or the pressure measured at 473 K? Explain your answer. 4. Write the equation for the line drawn in question 2. Using this equation, calculate the pressure of the gas at 323 K. Show your work. equation for the line: Pressure: 5. Examine the graph in Figure 1. The slope of the graph is equal to M X R, where M is the concentration of the gas in moles/liter, and R is a constant (R= 0.0821 concentration of the gas in this experiment. Show your work. L atm -). Calculate the mol °C
Expert Solution
trending now

Trending now

This is a popular solution!

steps

Step by step

Solved in 3 steps with 2 images

Blurred answer
Knowledge Booster
Application of Algebra
Learn more about
Need a deep-dive on the concept behind this application? Look no further. Learn more about this topic, geometry and related others by exploring similar questions and additional content below.
Recommended textbooks for you
Functions and Change: A Modeling Approach to Coll…
Algebra
ISBN:
9781337111348
Author:
Bruce Crauder, Benny Evans, Alan Noell
Publisher:
Cengage Learning
Holt Mcdougal Larson Pre-algebra: Student Edition…
Algebra
ISBN:
9780547587776
Author:
HOLT MCDOUGAL
Publisher:
HOLT MCDOUGAL
Mathematics For Machine Technology
Advanced Math
ISBN:
9781337798310
Author:
Peterson, John.
Publisher:
Cengage Learning,