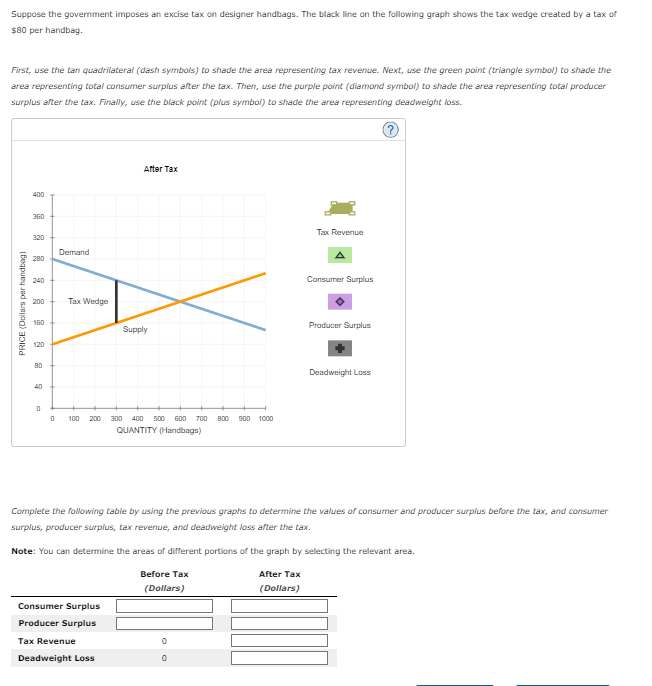
Suppose the government imposes an excise tax on designer handbags. The black line on the following graph shows the tax wedge created by a tax of $80 per handbag. First, use the tan quadrilateral (dash symbols) to shade the area representing tax revenue. Next, use the green point (triangle symbol) to shade the area representing total consumer surplus after the tax. Then, use the purple point (diamond symbol) to shade the area representing total producer surplus after the tax. Finally, use the black point (plus symbol) to shade the area representing deadweight loss. PRICE (Dollars per handbag) 400 360 320 280 240 200 160 120 80 40 0 Demand Tax Wedge After Tax 0 100 200 300 400 500 600 700 800 900 1000 QUANTITY (Handbags) Consumer Surplus Producer Surplus Supply Tax Revenue Deadweight Loss 0 Tax Revenue After Tax (Dollars) A Complete the following table by using the previous graphs to determine the values of consumer and producer surplus before the tax, and consumer surplus, producer surplus, tax revenue, and deadweight loss after the tax. Note: You can determine the areas of different portions of the graph by selecting the relevant area. Before Tax (Dollars) Consumer Surplus Producer Surplus Deadweight Loss
Suppose the government imposes an excise tax on designer handbags. The black line on the following graph shows the tax wedge created by a tax of $80 per handbag. First, use the tan quadrilateral (dash symbols) to shade the area representing tax revenue. Next, use the green point (triangle symbol) to shade the area representing total consumer surplus after the tax. Then, use the purple point (diamond symbol) to shade the area representing total producer surplus after the tax. Finally, use the black point (plus symbol) to shade the area representing deadweight loss. PRICE (Dollars per handbag) 400 360 320 280 240 200 160 120 80 40 0 Demand Tax Wedge After Tax 0 100 200 300 400 500 600 700 800 900 1000 QUANTITY (Handbags) Consumer Surplus Producer Surplus Supply Tax Revenue Deadweight Loss 0 Tax Revenue After Tax (Dollars) A Complete the following table by using the previous graphs to determine the values of consumer and producer surplus before the tax, and consumer surplus, producer surplus, tax revenue, and deadweight loss after the tax. Note: You can determine the areas of different portions of the graph by selecting the relevant area. Before Tax (Dollars) Consumer Surplus Producer Surplus Deadweight Loss

Principles of Macroeconomics (MindTap Course List)
8th Edition
ISBN:9781305971509
Author:N. Gregory Mankiw
Publisher:N. Gregory Mankiw
Chapter7: Consumers, Producers, And The Efficiency Of Markets
Section: Chapter Questions
Problem 6PA

Related questions
Question
Can someone answer this question correctly for me, please? I will really appreciate it :)
Note:-
Do not provide handwritten solution. Maintain accuracy and quality in your answer.
Take care of plagiarism.
Answer completely.
You will get up vote for sure.
Transcribed Image Text:Suppose the government imposes an excise tax on designer handbags. The black line on the following graph shows the tax wedge created by a tax of
$80 per handbag.
First, use the tan quadrilateral (dash symbols) to shade the area representing tax revenue. Next, use the green point (triangle symbol) to shade the
area representing total consumer surplus after the tax. Then, use the purple point (diamond symbol) to shade the area representing total producer
surplus after the tax. Finally, use the black point (plus symbol) to shade the area representing deadweight loss.
PRICE (Dollars per handbag)
400
360
320
280
240
200
160
120
80
40
0
Demand
Tax Wedge
After Tax
0 100 200 300 400 500 600 700 800 900 1000
QUANTITY (Handbags)
Consumer Surplus
Producer Surplus
Supply
Tax Revenue
Deadweight Loss
0
Tax Revenue
After Tax
(Dollars)
A
Complete the following table by using the previous graphs to determine the values of consumer and producer surplus before the tax, and consumer
surplus, producer surplus, tax revenue, and deadweight loss after the tax.
Note: You can determine the areas of different portions of the graph by selecting the relevant area.
Before Tax
(Dollars)
Consumer Surplus
Producer Surplus
Deadweight Loss
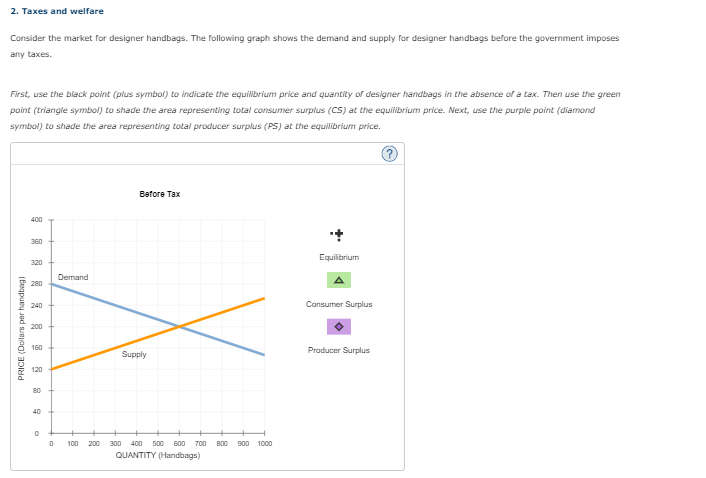
Transcribed Image Text:2. Taxes and welfare
Consider the market for designer handbags. The following graph shows the demand and supply for designer handbags before the government imposes
any taxes.
First, use the black point (plus symbol) to indicate the equilibrium price and quantity of designer handbags in the absence of a tax. Then use the green
point (triangle symbol) to shade the area representing total consumer surplus (CS) at the equilibrium price. Next, use the purple point (diamond
symbol) to shade the area representing total producer surplus (PS) at the equilibrium price.
PRICE (Dollars per handbag)
400
360
320
280
240
200
160
120
80
40
0
0
Demand
Before Tax
Supply
100 200 300 400 500 600 700 800 900
QUANTITY (Handbags)
1000
+
Equilibrium
A
Consumer Surplus
Producer Surplus
Expert Solution
This question has been solved!
Explore an expertly crafted, step-by-step solution for a thorough understanding of key concepts.

This is a popular solution!

Trending now
This is a popular solution!

Step by step
Solved in 3 steps with 4 images

Knowledge Booster


Learn more about
Need a deep-dive on the concept behind this application? Look no further. Learn more about this topic, economics and related others by exploring similar questions and additional content below.Recommended textbooks for you
Principles of Macroeconomics (MindTap Course List)
Economics
ISBN:
9781305971509
Author:
N. Gregory Mankiw
Publisher:
Cengage Learning

Principles of Economics (MindTap Course List)
Economics
ISBN:
9781305585126
Author:
N. Gregory Mankiw
Publisher:
Cengage Learning

Principles of Microeconomics (MindTap Course List)
Economics
ISBN:
9781305971493
Author:
N. Gregory Mankiw
Publisher:
Cengage Learning
Principles of Macroeconomics (MindTap Course List)
Economics
ISBN:
9781305971509
Author:
N. Gregory Mankiw
Publisher:
Cengage Learning
Principles of Economics (MindTap Course List)
Economics
ISBN:
9781305585126
Author:
N. Gregory Mankiw
Publisher:
Cengage Learning
Principles of Microeconomics (MindTap Course List)
Economics
ISBN:
9781305971493
Author:
N. Gregory Mankiw
Publisher:
Cengage Learning

Principles of Macroeconomics (MindTap Course List)
Economics
ISBN:
9781285165912
Author:
N. Gregory Mankiw
Publisher:
Cengage Learning

Essentials of Economics (MindTap Course List)
Economics
ISBN:
9781337091992
Author:
N. Gregory Mankiw
Publisher:
Cengage Learning

Principles of Economics, 7th Edition (MindTap Cou…
Economics
ISBN:
9781285165875
Author:
N. Gregory Mankiw
Publisher:
Cengage Learning