Suppose the HR manager of a company is interested in determining whether there is a difference in employee satisfaction across three different office locations. They randomly select 20 employees and ask each employee to rate their satisfaction with each office location on a scale of 1 (very dissatisfied) to 5 (very satisfied). The data are presented below: Employee 1 2 23 3 45 5 5D 7 8 10 11 12 13 14 15 67892 16 17 18 19 20 Office Location Location Location A B 4 3 3524 5 3524 5 2 3 345 NMUM & 2 3 5 3 4 245 5 WN SWANSA WNS WA WANS WAS 4 3 5 2 4 3 4 3 5 2 3 4 5 2 4 3 5 2 3 Location C 3 24 3 52 5 2 435NS & MINI MIN 5 2 5 4 3 2 4 2 5 3 5 4
Suppose the HR manager of a company is interested in determining whether there is a difference in employee satisfaction across three different office locations. They randomly select 20 employees and ask each employee to rate their satisfaction with each office location on a scale of 1 (very dissatisfied) to 5 (very satisfied). The data are presented below: Employee 1 2 23 3 45 5 5D 7 8 10 11 12 13 14 15 67892 16 17 18 19 20 Office Location Location Location A B 4 3 3524 5 3524 5 2 3 345 NMUM & 2 3 5 3 4 245 5 WN SWANSA WNS WA WANS WAS 4 3 5 2 4 3 4 3 5 2 3 4 5 2 4 3 5 2 3 Location C 3 24 3 52 5 2 435NS & MINI MIN 5 2 5 4 3 2 4 2 5 3 5 4

MATLAB: An Introduction with Applications
6th Edition
ISBN:9781119256830
Author:Amos Gilat
Publisher:Amos Gilat
Chapter1: Starting With Matlab
Section: Chapter Questions
Problem 1P

Related questions
Question
Transcribed Image Text:(a)
(b)
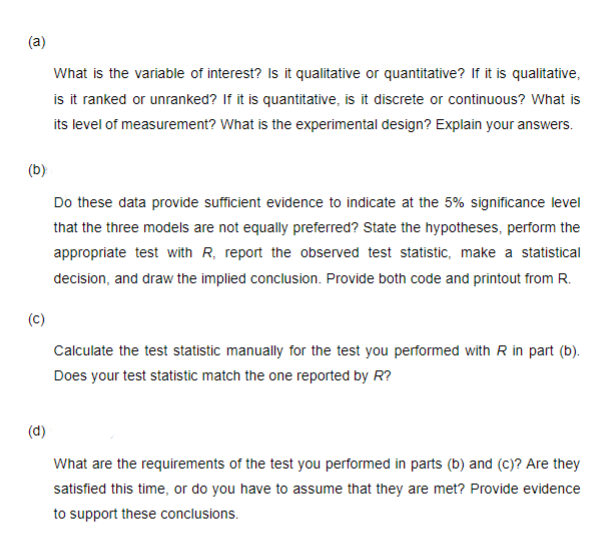
Do these data provide sufficient evidence to indicate at the 5% significance level
that the three models are not equally preferred? State the hypotheses, perform the
appropriate test with R, report the observed test statistic, make a statistical
decision, and draw the implied conclusion. Provide both code and printout from R.
(C)
What is the variable of interest? Is it qualitative or quantitative? If it is qualitative,
is it ranked or unranked? If it is quantitative, is it discrete or continuous? What is
its level of measurement? What is the experimental design? Explain your answers.
(d)
Calculate the test statistic manually for the test you performed with R in part (b).
Does your test statistic match the one reported by R?
What are the requirements of the test you performed in parts (b) and (c)? Are they
satisfied this time, or do you have to assume that they are met? Provide evidence
to support these conclusions.
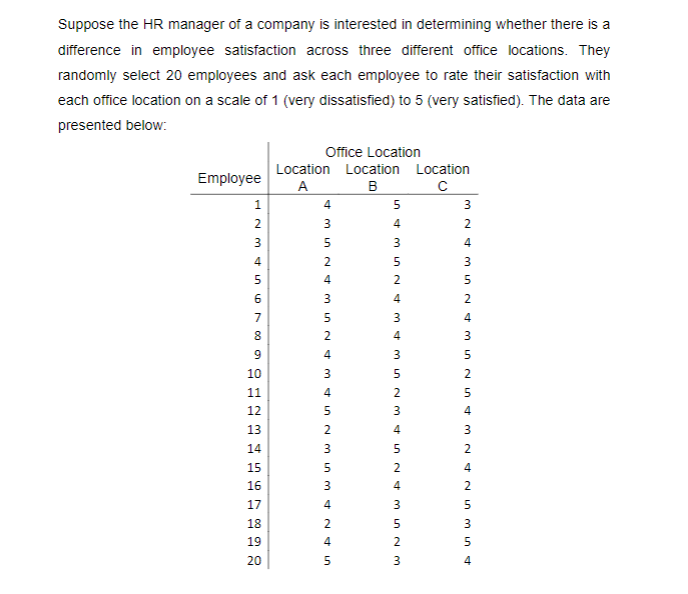
Transcribed Image Text:Suppose the HR manager of a company is interested in determining whether there is a
difference in employee satisfaction across three different office locations. They
randomly select 20 employees and ask each employee to rate their satisfaction with
each office location on a scale of 1 (very dissatisfied) to 5 (very satisfied). The data are
presented below:
Employee
HNM st in 6780
1
2
3
4
5
8
9
10
11
Office Location
Location Location Location
B
с
435N & MINN
2
4
3
5
2
4
12 13 14 15 16 17 18 19 20
MINN MINN45
3
4
5
2
3
3
2
L43524
3
m st
4
3
WNS WANUAWN SE
5
2
3
4
5
2
4
3
5
2
3
3
MNAMIN NAMIN INI Min min
2
4
3
5
2
4
3
5
2
5
4
3
2
4
2
5
3
5
4
Expert Solution
This question has been solved!
Explore an expertly crafted, step-by-step solution for a thorough understanding of key concepts.
Step 1: Write the given information
VIEWStep 2: Determine the variable of interest and the type of measurement of this variable
VIEWStep 3: Determine whether the data provide evidence that the three models are not equally preferred using R
VIEWStep 4: Determine whether the data provide evidence that the three models are not equally preferred
VIEWSolution
VIEW
Step by step
Solved in 5 steps with 18 images

Recommended textbooks for you
MATLAB: An Introduction with Applications
Statistics
ISBN:
9781119256830
Author:
Amos Gilat
Publisher:
John Wiley & Sons Inc

Probability and Statistics for Engineering and th…
Statistics
ISBN:
9781305251809
Author:
Jay L. Devore
Publisher:
Cengage Learning

Statistics for The Behavioral Sciences (MindTap C…
Statistics
ISBN:
9781305504912
Author:
Frederick J Gravetter, Larry B. Wallnau
Publisher:
Cengage Learning
MATLAB: An Introduction with Applications
Statistics
ISBN:
9781119256830
Author:
Amos Gilat
Publisher:
John Wiley & Sons Inc
Probability and Statistics for Engineering and th…
Statistics
ISBN:
9781305251809
Author:
Jay L. Devore
Publisher:
Cengage Learning
Statistics for The Behavioral Sciences (MindTap C…
Statistics
ISBN:
9781305504912
Author:
Frederick J Gravetter, Larry B. Wallnau
Publisher:
Cengage Learning

Elementary Statistics: Picturing the World (7th E…
Statistics
ISBN:
9780134683416
Author:
Ron Larson, Betsy Farber
Publisher:
PEARSON

The Basic Practice of Statistics
Statistics
ISBN:
9781319042578
Author:
David S. Moore, William I. Notz, Michael A. Fligner
Publisher:
W. H. Freeman

Introduction to the Practice of Statistics
Statistics
ISBN:
9781319013387
Author:
David S. Moore, George P. McCabe, Bruce A. Craig
Publisher:
W. H. Freeman