Suppose the mean height of women age 20 years or older in a certain country is 62.7 inches. One hundred randomly selected women in a certain city had a mean height of 63.9 inches. At the 1% significance level, do the data provide sufficient evidence to conclude that the mean height of women in the city differs from the national mean? Assume that the population standard deviation of the heights of women in the city is 3.8 inches. Click here to view a partial table of areas under the standard normal curve. Set up the hypotheses for the one-mean z-test. Ho H 62.7 H3 u 62.7 The test statistic is z= 3.16 (Round to two decimal places as needed.) The P-value is (Round to four decimal places as needed.)
Suppose the mean height of women age 20 years or older in a certain country is 62.7 inches. One hundred randomly selected women in a certain city had a mean height of 63.9 inches. At the 1% significance level, do the data provide sufficient evidence to conclude that the mean height of women in the city differs from the national mean? Assume that the population standard deviation of the heights of women in the city is 3.8 inches. Click here to view a partial table of areas under the standard normal curve. Set up the hypotheses for the one-mean z-test. Ho H 62.7 H3 u 62.7 The test statistic is z= 3.16 (Round to two decimal places as needed.) The P-value is (Round to four decimal places as needed.)

A First Course in Probability (10th Edition)
10th Edition
ISBN:9780134753119
Author:Sheldon Ross
Publisher:Sheldon Ross
Chapter1: Combinatorial Analysis
Section: Chapter Questions
Problem 1.1P: a. How many different 7-place license plates are possible if the first 2 places are for letters and...

Related questions
Question
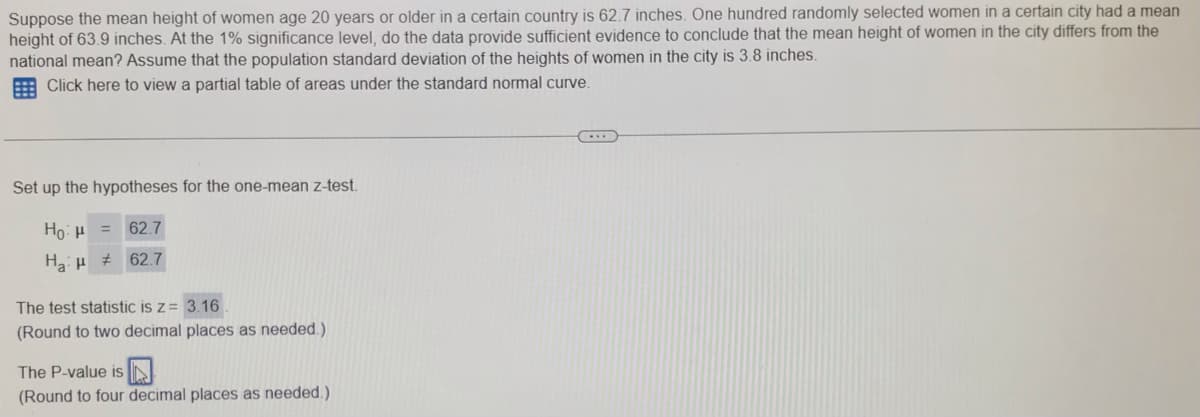
Transcribed Image Text:Suppose the mean height of women age 20 years or older in a certain country is 62.7 inches. One hundred randomly selected women in a certain city had a mean
height of 63.9 inches. At the 1% significance level, do the data provide sufficient evidence to conclude that the mean height of women in the city differs from the
national mean? Assume that the population standard deviation of the heights of women in the city is 3.8 inches.
Click here to view a partial table of areas under the standard normal curve.
Set up the hypotheses for the one-mean z-test.
Ho: H
62.7
Ha H 62.7
The test statistic is z= 3.16
(Round to two decimal places as needed.)
The P-value is
(Round to four decimal places as needed.)
Expert Solution
This question has been solved!
Explore an expertly crafted, step-by-step solution for a thorough understanding of key concepts.

Step by step
Solved in 2 steps

Recommended textbooks for you
A First Course in Probability (10th Edition)
Probability
ISBN:
9780134753119
Author:
Sheldon Ross
Publisher:
PEARSON

A First Course in Probability (10th Edition)
Probability
ISBN:
9780134753119
Author:
Sheldon Ross
Publisher:
PEARSON