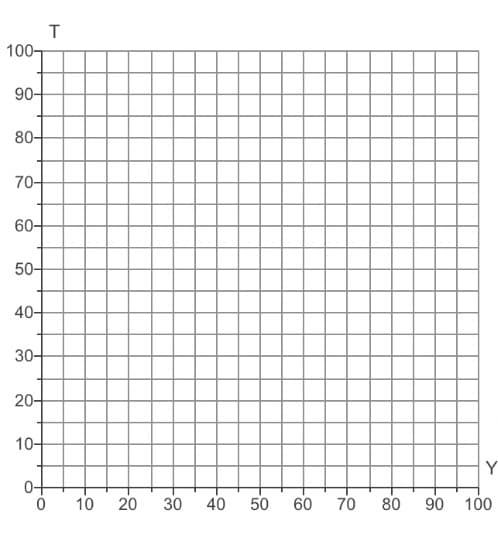
Suppose the relationship between the government's tax revenue (T) and national income (Y) is represented by the equation T = 30 +0.5Y. Plot this relationship on a scale diagram, with Y on the horizontal axis and T on the vertical axis. Interpret the equation. Use the line drawing tool to draw the equation. Make sure to plot the vertical axis as one endpoint of the line. Properly label this line. Carefully follow the instructions above, and only draw the required objects.
Suppose the relationship between the government's tax revenue (T) and national income (Y) is represented by the equation T = 30 +0.5Y. Plot this relationship on a scale diagram, with Y on the horizontal axis and T on the vertical axis. Interpret the equation. Use the line drawing tool to draw the equation. Make sure to plot the vertical axis as one endpoint of the line. Properly label this line. Carefully follow the instructions above, and only draw the required objects.

Managerial Economics: Applications, Strategies and Tactics (MindTap Course List)
14th Edition
ISBN:9781305506381
Author:James R. McGuigan, R. Charles Moyer, Frederick H.deB. Harris
Publisher:James R. McGuigan, R. Charles Moyer, Frederick H.deB. Harris
Chapter14: Pricing Techniques And Analysis
Section: Chapter Questions
Problem 1.1CE: What life cycle cost concept begins raising concerns by year 5 with any electric vehicle (EV)? If...

Related questions
Question
100%
Suppose the relationship between the government's tax revenue (T) and
Use the line drawing tool to draw the equation. Make sure to plot the vertical axis as one endpoint of the line. Properly label this line.
Carefully follow the instructions above, and only draw the required objects.
Transcribed Image Text:T
100-
90-
80-
70-
60-
50-
40-
30-
20-
10-
Y
10
30
40
50
60
70
80
90
100
20
Expert Solution
This question has been solved!
Explore an expertly crafted, step-by-step solution for a thorough understanding of key concepts.

This is a popular solution!

Trending now
This is a popular solution!

Step by step
Solved in 3 steps with 2 images

Recommended textbooks for you
Managerial Economics: Applications, Strategies an…
Economics
ISBN:
9781305506381
Author:
James R. McGuigan, R. Charles Moyer, Frederick H.deB. Harris
Publisher:
Cengage Learning
Managerial Economics: Applications, Strategies an…
Economics
ISBN:
9781305506381
Author:
James R. McGuigan, R. Charles Moyer, Frederick H.deB. Harris
Publisher:
Cengage Learning