For each of the following variables, determine whether the variable is categorical or numerical. If the variable is numerical, determine whether the variable is discrete or continuous. In addition, determine the measurement scale. a. Time, in hours, spent working per month b. Name of a household's cable television provider c. Number of online purchases made in a month
For each of the following variables, determine whether the variable is categorical or numerical. If the variable is numerical, determine whether the variable is discrete or continuous. In addition, determine the measurement scale. a. Time, in hours, spent working per month b. Name of a household's cable television provider c. Number of online purchases made in a month

Managerial Economics: Applications, Strategies and Tactics (MindTap Course List)
14th Edition
ISBN:9781305506381
Author:James R. McGuigan, R. Charles Moyer, Frederick H.deB. Harris
Publisher:James R. McGuigan, R. Charles Moyer, Frederick H.deB. Harris
Chapter4A: Problems In Applying The Linear Regression Model
Section: Chapter Questions
Problem 5E

Related questions
Question
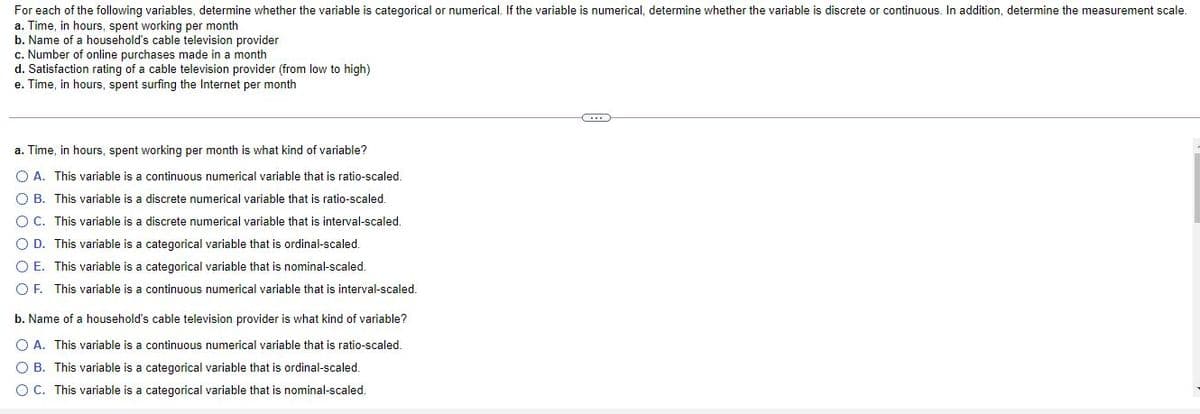
Transcribed Image Text:For each of the following variables, determine whether the variable is categorical or numerical. If the variable is numerical, determine whether the variable is discrete or continuous. In addition, determine the measurement scale.
a. Time, in hours, spent working per month
b. Name of a household's cable television provider
c. Number of online purchases made in a month
d. Satisfaction rating of a cable television provider (from low to high)
e. Time, in hours, spent surfing the Internet per month
a. Time, in hours, spent working per month is what kind of variable?
O A. This variable is a continuous numerical variable that is ratio-scaled.
O B. This variable is a discrete numerical variable that is ratio-scaled.
OC. This variable is a discrete numerical variable that is interval-scaled.
O D. This variable is a categorical variable that is ordinal-scaled.
O E. This variable is a categorical variable that is nominal-scaled.
O F. This variable is a continuous numerical variable that is interval-scaled.
b. Name of a household's cable television provider is what kind of variable?
O A. This variable is a continuous numerical variable that is ratio-scaled.
O B. This variable is a categorical variable that is ordinal-scaled.
OC. This variable is a categorical variable that is nominal-scaled.
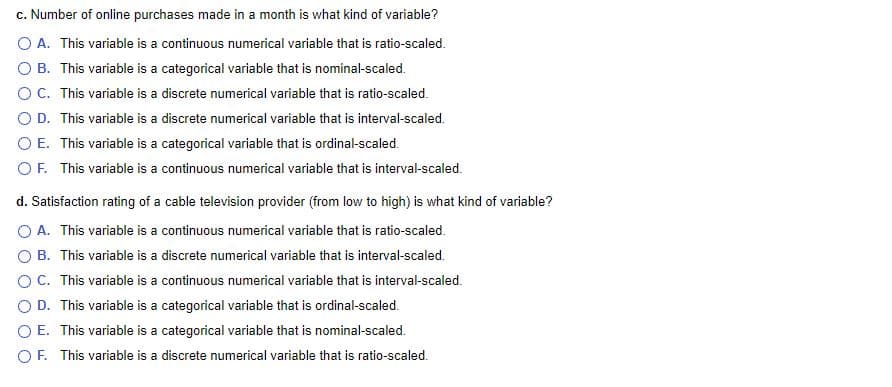
Transcribed Image Text:c. Number of online purchases made in a month is what kind of variable?
O A. This variable is a continuous numerical variable that is ratio-scaled.
O B. This variable is a categorical variable that is nominal-scaled.
OC. This variable is a discrete numerical variable that is ratio-scaled.
O D. This variable is a discrete numerical variable that is interval-scaled.
O E. This variable is a categorical variable that is ordinal-scaled.
OF. This variable is a continuous numerical variable that is interval-scaled.
d. Satisfaction rating of a cable television provider (from low to high) is what kind of variable?
O A. This variable is a continuous numerical variable that is ratio-scaled.
O B. This variable is a discrete numerical variable that is interval-scaled.
OC. This variable is a continuous numerical variable that is interval-scaled.
D. This variable is a categorical variable that is ordinal-scaled.
O E. This variable is a categorical variable that is nominal-scaled.
OF. This variable is a discrete numerical variable that is ratio-scaled.
Expert Solution
This question has been solved!
Explore an expertly crafted, step-by-step solution for a thorough understanding of key concepts.

This is a popular solution!

Trending now
This is a popular solution!

Step by step
Solved in 2 steps

Recommended textbooks for you
Managerial Economics: Applications, Strategies an…
Economics
ISBN:
9781305506381
Author:
James R. McGuigan, R. Charles Moyer, Frederick H.deB. Harris
Publisher:
Cengage Learning


Managerial Economics: Applications, Strategies an…
Economics
ISBN:
9781305506381
Author:
James R. McGuigan, R. Charles Moyer, Frederick H.deB. Harris
Publisher:
Cengage Learning

