Suppose there is some hypothetical economy in which households spend $0.50 of each additional dollar they earn and save the $0.50 they have left over. The following graph plots the economy's initial aggregate demand curve (AD₁). Suppose now that the government increases its purchases by $3.5 billion. Use the green line (triangle symbol) on the following graph to show the aggregate demand curve (AD₂) after the multiplier effect takes place. Hint: Be sure the new aggregate demand curve (AD2) is parallel to AD₁. You can see the slope of AD, by selecting it on the following graph. (?) PRICE LEVEL 116 114 112 110 108 106 104 102 + 100 AD₁ 100 102 104 106 108 110 OUTPUT (Billions of dollars) 112 114 116 κάπου Δήμου AD2 AD3 he following graph plots equilibrium in the money market at an interest rate of 6% and a quantity of money equal to $60 billion.
Suppose there is some hypothetical economy in which households spend $0.50 of each additional dollar they earn and save the $0.50 they have left over. The following graph plots the economy's initial aggregate demand curve (AD₁). Suppose now that the government increases its purchases by $3.5 billion. Use the green line (triangle symbol) on the following graph to show the aggregate demand curve (AD₂) after the multiplier effect takes place. Hint: Be sure the new aggregate demand curve (AD2) is parallel to AD₁. You can see the slope of AD, by selecting it on the following graph. (?) PRICE LEVEL 116 114 112 110 108 106 104 102 + 100 AD₁ 100 102 104 106 108 110 OUTPUT (Billions of dollars) 112 114 116 κάπου Δήμου AD2 AD3 he following graph plots equilibrium in the money market at an interest rate of 6% and a quantity of money equal to $60 billion.

Chapter19: The Keynesian Model In Action
Section: Chapter Questions
Problem 5SQP

Related questions
Question
Answer everything in the photos including both of the graphs.
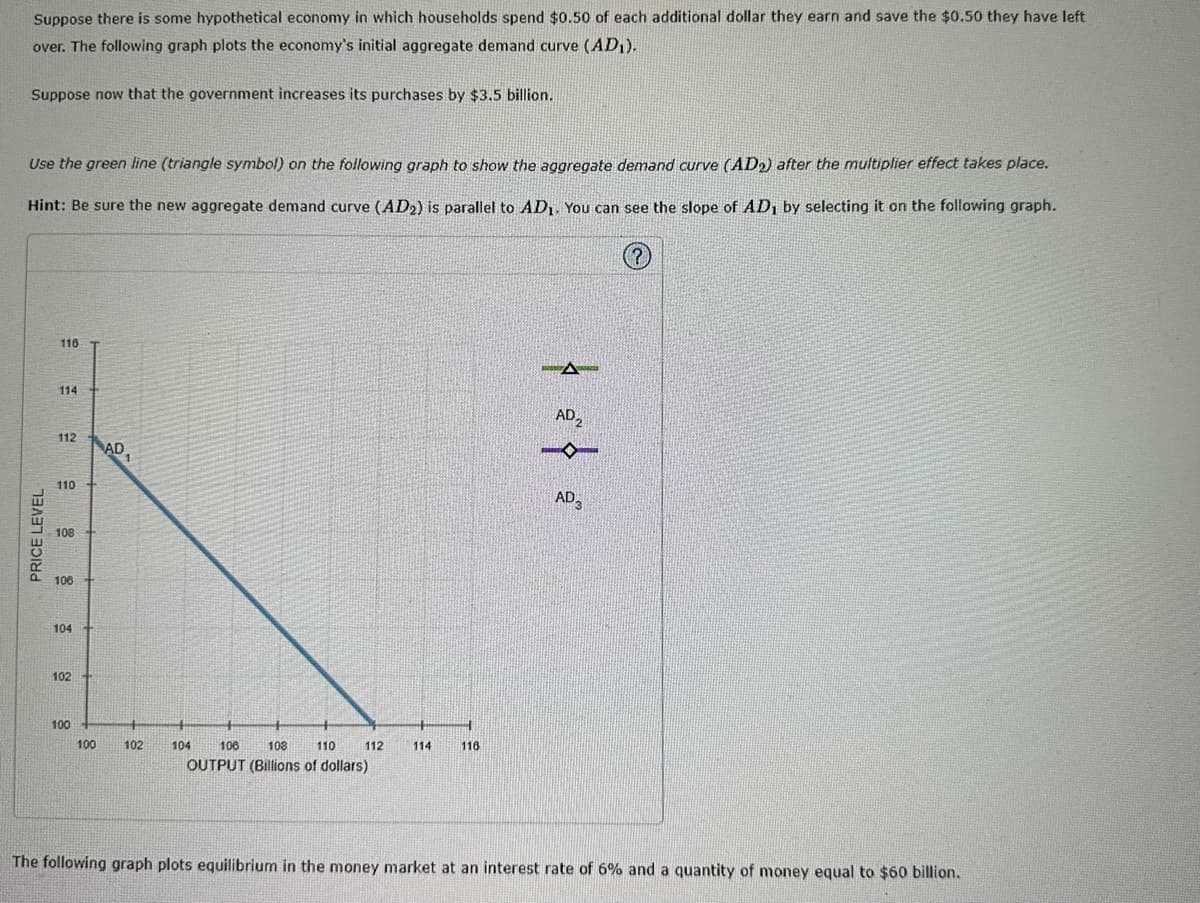
Transcribed Image Text:Suppose there is some hypothetical economy in which households spend $0.50 of each additional dollar they earn and save the $0.50 they have left
over. The following graph plots the economy's initial aggregate demand curve (AD₁).
Suppose now that the government increases its purchases by $3.5 billion.
Use the green line (triangle symbol) on the following graph to show the aggregate demand curve (AD₂) after the multiplier effect takes place.
Hint: Be sure the new aggregate demand curve (AD₂) is parallel to AD₁. You can see the slope of AD₁ by selecting it on the following graph.
PRICE LEVEL
116
114
112
110
108
106
104
102 +
100
100
AD₁
102
104
106
108
110
OUTPUT (Billions of dollars)
112
114
116
A
AD₂
AD3
The following graph plots equilibrium in the money market at an interest rate of 6% and a quantity of money equal to $60 billion.
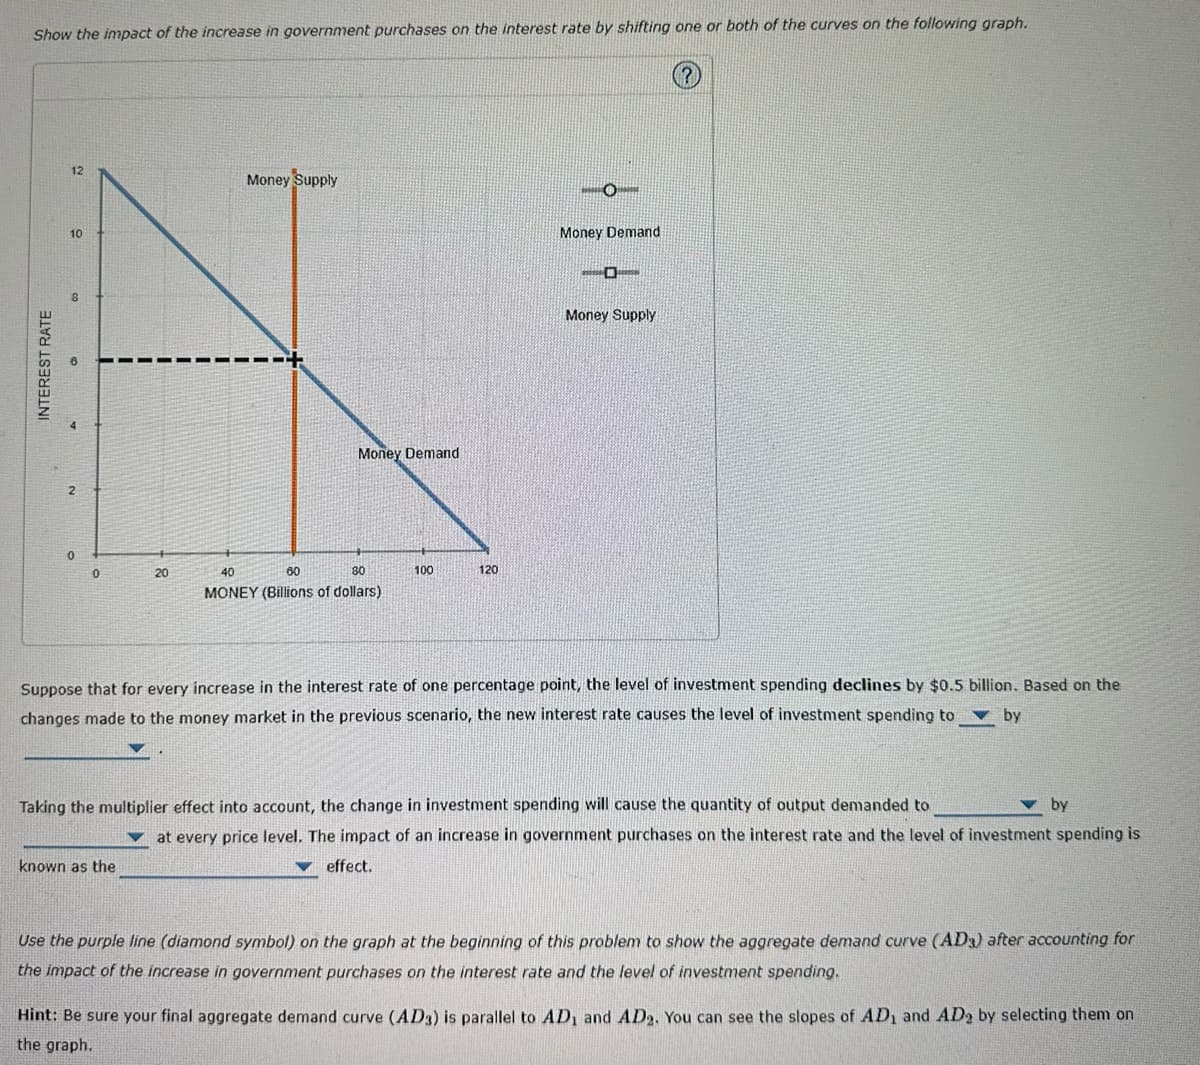
Transcribed Image Text:Show the impact of the increase in government purchases on the interest rate by shifting one or both of the curves on the following graph.
?
INTEREST RATE
12
10
g
co
60
2
0
0
20
Money Supply
known as the
--+
Money Demand
60
80
40
MONEY (Billions of dollars)
100
120
Money Demand
O
Money Supply
Suppose that for every increase in the interest rate of one percentage point, the level of investment spending declines by $0.5 billion. Based on the
changes made to the money market in the previous scenario, the new interest rate causes the level of investment spending to by
Taking the multiplier effect into account, the change in investment spending will cause the quantity of output demanded to
by
at every price level. The impact of an increase in government purchases on the interest rate and the level of investment spending is
effect.
Use the purple line (diamond symbol) on the graph at the beginning of this problem to show the aggregate demand curve (AD3) after accounting for
the impact of the increase in government purchases on the interest rate and the level of investment spending.
Hint: Be sure your final aggregate demand curve (AD3) is parallel to AD, and AD2. You can see the slopes of AD, and AD2 by selecting them on
the graph.
Expert Solution
This question has been solved!
Explore an expertly crafted, step-by-step solution for a thorough understanding of key concepts.

This is a popular solution!

Trending now
This is a popular solution!

Step by step
Solved in 5 steps with 2 images

Knowledge Booster


Learn more about
Need a deep-dive on the concept behind this application? Look no further. Learn more about this topic, economics and related others by exploring similar questions and additional content below.Recommended textbooks for you


Macroeconomics: Principles and Policy (MindTap Co…
Economics
ISBN:
9781305280601
Author:
William J. Baumol, Alan S. Blinder
Publisher:
Cengage Learning
