Suppose we have a market with upward sloping supply and downward sloping demand curves. After which of the following shocks can we guarantee that equilibrium price will increase? O A shock which simultaneously shifts the supply curve downwards and the demand curve upwards. O A shock which shifts the demand curve downwards. O A shock which simultaneously shifts the supply curve downwards and the demand curve downwards. OA shock which shifts the supply curve upwards. O More than one of the above.
Suppose we have a market with upward sloping supply and downward sloping demand curves. After which of the following shocks can we guarantee that equilibrium price will increase? O A shock which simultaneously shifts the supply curve downwards and the demand curve upwards. O A shock which shifts the demand curve downwards. O A shock which simultaneously shifts the supply curve downwards and the demand curve downwards. OA shock which shifts the supply curve upwards. O More than one of the above.

Chapter20: Aggregate Demand And Supply
Section: Chapter Questions
Problem 11SQ

Related questions
Question
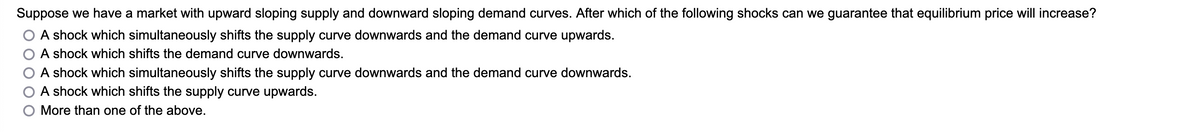
Transcribed Image Text:Suppose we have a market with upward sloping supply and downward sloping demand curves. After which of the following shocks can we guarantee that equilibrium price will increase?
A shock which simultaneously shifts the supply curve downwards and the demand curve upwards.
A shock which shifts the demand curve downwards.
A shock which simultaneously shifts the supply curve downwards and the demand curve downwards.
A shock which shifts the supply curve upwards.
More than one of the above.
Expert Solution
This question has been solved!
Explore an expertly crafted, step-by-step solution for a thorough understanding of key concepts.

Step by step
Solved in 4 steps

Knowledge Booster


Learn more about
Need a deep-dive on the concept behind this application? Look no further. Learn more about this topic, economics and related others by exploring similar questions and additional content below.Recommended textbooks for you

