Suppose we have the following values for actual values (ACTUAL) and forecasted values (FCAST): ACTUAL FCAST 8 10 What is the value of the RMSE?
Suppose we have the following values for actual values (ACTUAL) and forecasted values (FCAST): ACTUAL FCAST 8 10 What is the value of the RMSE?

Chapter6: Exponential And Logarithmic Functions
Section6.8: Fitting Exponential Models To Data
Problem 1TI: Table 2 shows a recent graduate’s credit card balance each month after graduation. a. Use...

Related questions
Question
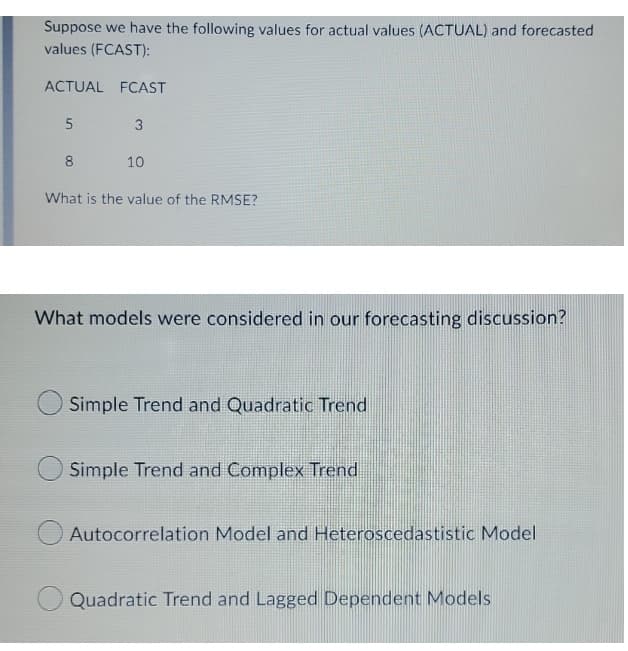
Transcribed Image Text:Suppose we have the following values for actual values (ACTUAL) and forecasted
values (FCAST):
ACTUAL FCAST
5
3
8
10
What is the value of the RMSE?
What models were considered in our forecasting discussion?
Simple Trend and Quadratic Trend
Simple Trend and Complex Trend
Autocorrelation Model and Heteroscedastistic Model
Quadratic Trend and Lagged Dependent Models
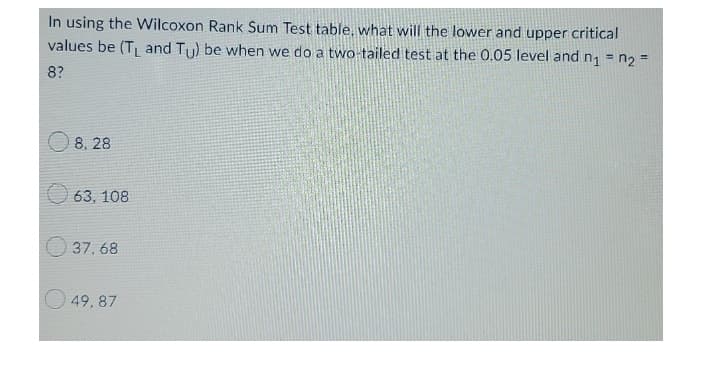
Transcribed Image Text:In using the Wilcoxon Rank Sum Test table, what will the lower and upper critical
values be (T₁ and Tu) be when we do a two-tailed test at the 0.05 level and n₁ = n₂ =
8?
8,28
63, 108
37,68
49,87
Expert Solution
This question has been solved!
Explore an expertly crafted, step-by-step solution for a thorough understanding of key concepts.

Step by step
Solved in 2 steps

Recommended textbooks for you

Algebra and Trigonometry (MindTap Course List)
Algebra
ISBN:
9781305071742
Author:
James Stewart, Lothar Redlin, Saleem Watson
Publisher:
Cengage Learning
Algebra and Trigonometry (MindTap Course List)
Algebra
ISBN:
9781305071742
Author:
James Stewart, Lothar Redlin, Saleem Watson
Publisher:
Cengage Learning