Suppose you are a researcher, and are examining how students make their way to university campuses. You take a survey of students and the method of transportation they took, summarized in the contingency table below: Fourth Year Transportation Type\Year of Study Walking First Year Second Year Third Year and above 501 229 172 101 Bus 223 276 131 97 Car 89 129 134 201 Using this information, what is the probability of randomly selecting a student in first or second year, given that they use a bus to get to campus? Provide your answer in percentage, accurate to two decimal places (note the row and column sums are not included). 55.28% 37.96% 79.04% 30.67% 68.64%
Suppose you are a researcher, and are examining how students make their way to university campuses. You take a survey of students and the method of transportation they took, summarized in the contingency table below: Fourth Year Transportation Type\Year of Study Walking First Year Second Year Third Year and above 501 229 172 101 Bus 223 276 131 97 Car 89 129 134 201 Using this information, what is the probability of randomly selecting a student in first or second year, given that they use a bus to get to campus? Provide your answer in percentage, accurate to two decimal places (note the row and column sums are not included). 55.28% 37.96% 79.04% 30.67% 68.64%

Chapter8: Sequences, Series,and Probability
Section8.7: Probability
Problem 11ECP: A manufacturer has determined that a machine averages one faulty unit for every 500 it produces....

Related questions
Question
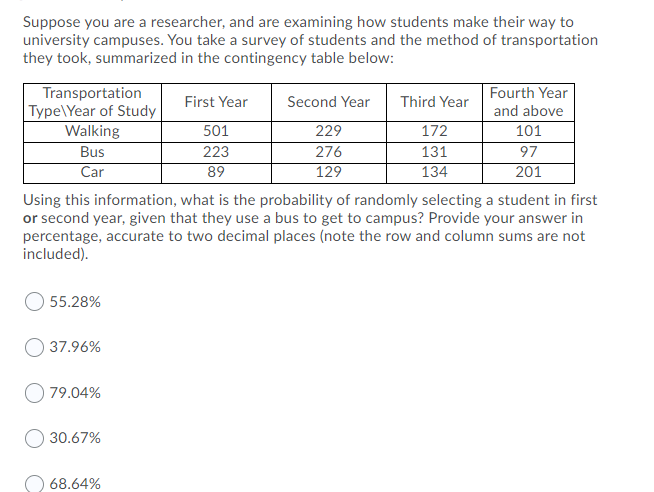
Transcribed Image Text:Suppose you are a researcher, and are examining how students make their way to
university campuses. You take a survey of students and the method of transportation
they took, summarized in the contingency table below:
Transportation
Type\Year of Study
Walking
Fourth Year
First Year
Second Year
Third Year
and above
501
229
172
101
Bus
223
276
131
97
Car
89
129
134
201
Using this information, what is the probability of randomly selecting a student in first
or second year, given that they use a bus to get to campus? Provide your answer in
percentage, accurate to two decimal places (note the row and column sums are not
included).
55.28%
37.96%
79.04%
30.67%
68.64%
Expert Solution
This question has been solved!
Explore an expertly crafted, step-by-step solution for a thorough understanding of key concepts.

Step by step
Solved in 2 steps with 2 images

Recommended textbooks for you