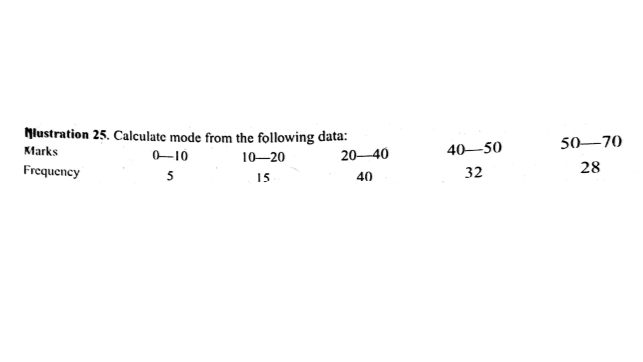
Nlustration 25. Calculate mode from the following data: Klarks 40-50 50–70 0-10 10-20 20-40 Frequency 5 IS 40 32 28


Q: The degrees of freedom is critical to computing the p-value for the chi-square goodness of fit. We w...
A: Given Information:Consider the data that shows the observed counts of F2 offspring from an F1 cross....
Q: TRUE OR FALSE 1. From the Kaplan-Meier approach of estimating survival probabilities, we can see if...
A: Kaplan Meier Method for Survival Probabilities: Kaplan Meier is a statistical method that analyses t...
Q: Ambient temperatures (°C) of the sites where the extremophilic bacterium species Deinococcus radiodu...
A: Five number summary : It has five measures : maximum value First quartile Second quartile / median T...
Q: A walk-in medical clinic believes that arrivals are uniformly distributed over weekdays (Monday thro...
A: In this case, the goodness of fit test is to be conducted to conclude if the discrepancy between the...
Q: Irite legibly. Avoid ndond 7. Test each given null hypothesis Ho against the given alternative hypot...
A: We have to test given hypothesis .
Q: For a frequency distribution of marks in Statistics for 100 students, the arithmetic average was fou...
A:
Q: Find the missing frequency in the following distribution if N is 100 and median is 30. Marks No. of ...
A:
Q: R² and r are defined by SR E(*; – T)(yi – ỹ) Say R? SST' r = VE(x; – #)² L(yi – g)² (1) Show R² = p2...
A: “Since you have asked multiple questions, we will solve the first question for you. If you want any ...
Q: Estimate the production for the years 1955 and 1965 with the help of the following table Year 1940 1...
A: Here, we have Year Production (000 tonnes) 1940 200 y0 1945 220 y1 1950 260 y2 1955 ? y...
Q: A player tosses two fair coins. He wins $ 5 if 2 heads occur, $ 2 if 1 head occurs and 1 if no head ...
A:
Q: (1) Cov(B1, yı) (2) Cov(Bo, Y1) (3) Cov(Bo, j)
A: Let Y = β0+β1X+εi be a linear regression model with the distribution where β0 = Y-β1X¯ and β1 = ∑...
Q: This dataset of size n - 51 is for the 50 states and the District of Columhia in the United States. ...
A: According to the answering guidelines, we can answer only three subparts of a question and the rest ...
Q: (a) Find Bowley's coefficient of skewness for the following frequency distribution:- No. of children...
A: The Bowley's coefficient of skewness is used to find whether the distribution is symmetric, positive...
Q: 4. Review the table and consider questions such as the following. Needs | Origin / Rating Satisfacto...
A: Since you have posted a question with multiple subparts, we will solve first three subparts for you....
Q: Construct a confidence interval for p1- P2 at the given level of confidence. x1 = 26, n1 = 270, x2 =...
A:
Q: 4) Consider evens A1, A2, A3 are mutually exclusive events, Let B be an event that intersects all th...
A: Given,P(A1)=0.5P(A2)=0.3P(A3)=0.1P(B|A1)=0.6P(B|A2)=0.1P(B|A3)=0.4
Q: which of the following statements is true if when using null hypothesis testing, our p value (in the...
A: Decision rule: If p-value is less than or equal to significance level, reject null hypothesis If p-v...
Q: Suppose that the lifetimes of tires of a certain brand are normally distributed with a mean of 74,00...
A:
Q: Count Respondents sex MALE FEMALE Total Favor or FAVOR 30 27 57 oppose death (expected) penalty for ...
A: Any assumption about the parameter or probability function is known as hypothesis testing. For the G...
Q: Calculate the correlation coefficient for the following data sets and then plot these data sets as s...
A: Disclaimer : Since you have asked multiple question, we will solve the first question for you. If yo...
Q: The Green party of Canada is planning on conducting a survey to estimate the proportion of Canadians...
A:
Q: The numbers racket is a well‑entrenched illegal gambling operation in most large cities. One version...
A: Central Limit Theorem for mean: If a random sample of size n is taken from a population having mean ...
Q: An experiment was conducted to determine the effect of exercises on elders' (above 60 years old) mem...
A: Test is that whether there is an effect of exercises on elder's memory. It is given that there are t...
Q: Calculate 20.062-
A: we want to calculate Z0.062
Q: Almost all medical schools in the United States require students to take the Medical College Admissi...
A: Solution: Given that: n= 25 Sample sizeμ= 510 Population mean σ= 10.4 Population standard deviation....
Q: lew sales representative A corporation damin Management is interested in the extent to which this te...
A: Solution: Let x = Test scores and y= Weekly Sales x y (x-x) (x-x)2 (y-y) (y-y)2 (x-x)(y-y) 55 1...
Q: (X1, X2, X3)' be a random sample from N(u, 1). Use the Fisher-Neyman Factorization Theorem to find a...
A:
Q: 1. Determine the number of wing flaps needed for 150,000 flying hours. 2. Is the regression model a ...
A: Use the Excel and Perform the Regression. Followings are the Steps to perform the Regression 1) Open...
Q: Suppose we take a random sample of size 25 form Bi(10, p). Find the pmf and the CDF of the 5th order...
A:
Q: In 2016, the CDC estimated the mean weight of U.S. women over the age of 20 years old was 168.5 poun...
A:
Q: The following summary data relate to the adult population of a small village: 600 Adult population N...
A:
Q: Derive the moment generating function of X ~ Bi(n, p) and using the MGF compute E[X] and Var[X].
A:
Q: Data relating to age of the students and their games. Calculate correlation between the age of the s...
A:
Q: Example 15. Find Average cost and Marginal cost, ifT=1000+ 100g – 10g? + q³.
A:
Q: Based on information on 1,000 randomly selected fields about the tenancy status of the cultivation o...
A:
Q: how can I know this if the samples were: Y= 3,80,80,80,80,80 Y= 45, 48,52,53,57 Question 2 In which ...
A:
Q: Find the standard deviation, s, of sample data summarized in the frequency distribution table given ...
A: Concentration of all the values around the central value of the given data is known as measures of c...
Q: (b) The number of divorces per 1000 marriages in a big city in Europe incrcased from 96 in 1960 to 1...
A:
Q: Classify the following statements as to whether they belong to the area of DescriptiveStatistics or ...
A: Descriptive and inferential statistics : The mean, variance, and frequency of a variable are all sam...
Q: Given the list of six numbers: 1, 2, 13, 50, 60, 62. If the number 70 is added to the list as the se...
A: Given data is 1,2,13,50,60,62Arrange the data in ascending order1,2,13,50,60,62Mean = sum of the dat...
Q: In a survey of 200 boys, of which 75 were intelligent, 40 had educated athers; while 85 of the unint...
A: Given information, Among 200 boys, of which 75 were intelligent, 40 has educated fathers and 85 of t...
Q: The amount of weight on an ACME tractor trailer is known to have a normal distribution with mean 9.5...
A:
Q: 3. An experiment is conducted to test whether the installation of cavity-wall insulation reduces the...
A: Given The data is as follows: α=0.05
Q: Chapter 06, Section 6.3, Problem 035 The pucks used by the National Hockey League for ice hockey mus...
A:
Q: From the following data calculate the missing frequency : No. of tablets : 4–8 8–12 12–16 16–20 20–2...
A: Given frequency table is No.of tables 4-8 8-12 12-16 16-20 20-24 24-28 28-32 32-36 36-40 No. of...
Q: A particular fruit's weights are normally distributed, with a mean of 604 grams and a standard devia...
A: GivenMean(μ)=604standard deviation(σ)=21
Q: For many people, breakfast cereal is an important source of fiber in their diets. Cereals also cont...
A: Given Potassium=39+28 fiber Fiber=9
Q: a 24-hour call center, complaints arrive at a mean rate of 1 complaint every 3 hours. (a) Find the ...
A:
Q: (a) Find Bowley's coefficient of skewness for the following frequency distribution:- No. of children...
A: Given: No. of children per family No. of families 0 7 1 10 2 16 3 25 4 18 5 41 6 8
Q: Find the sample variance and-standard deviation for the following sample. Round the answers to two d...
A:

Step by step
Solved in 2 steps with 2 images

- Given data points: (2,3), (3,4), (5,2), (6,5) and (7,3) indicate ln(y-C1) = C2+ ln x , using Least Square Method.Curve Fitting using the formula, (FT)(F)(C) = (FT)(y)F = matrixFT = transpose of matrixC = constanty = data givenHere is a dataset containing plant growth measurements of plants grown in solutions of commonly-found chemicals in roadway runoff.Phragmites australis, a fast-growing non-native grass common to roadsides and disturbed wetlands of Tidewater Virginia, was grown in a greenhouse and watered with either: Distilled water (control); A weak petroleum solution (representing standard roadway runoff); Sodium chloride solution; Magnesium chloride solution; De-icing brine (50% sodium chloride and 50% magnesium chloride).Twenty grass preparations were used for each solution, and total growth (in cm) was recorded after watering every other day for 40 days.-Perform the correct statistical test to determine the p-value.-Report your answer rounded to four decimal places.-You should use formulas, functions, and the Data Analysis ToolPak in MS Excel to avoid additive rounding errors. Here are some useful functions: =t.test(array1,array2,tails,type) Produces a p-value for any…calculate d and e with good working outs ...
- IOG Technologies offers semiconductor and system solutions for automotive industrial and multimarket sectors for applications in communication. The following data relates to the production of three products manufactured by them: Product Price (RM) Quantity 2000 2016 2000 2016 BD-1005 3.00 3.20 60 80 LCM-2134 2.00 2.50 100 90 DDK-456 3.50 4.00 500 700 Determine the Laspeyres Price Index (LPI) and Paasche Price Index (PPI) for 2016 using 2000 as the base period.A quality control engineer studied the relationship between years of experience as a system control engineer and the capacity of the engineer to complete within a given time a complex control design including the debugging of all computer programs and control devices. A group of 25 engineers having widely differing amounts of experience (measured in months of experience) was given the same control design project. The results of the study are given in the following table with y = 1 if the project was successfully completed in the allocated time and y = 0 if the project was not successfully completed. a. Determine whether experience is associated with the probability of completingthe task. b. Compute the probability of successfully completing the task for an engineer having 24 months of experience. Place a 95% confidence interval on your estimate.A municipal solid-waste site for a city must be located at Site A or Site B. After sorting, some of the solid refuse will be transported to an electric powerplant where it will be used as fuel. Data for the hauling of refuse from each site to the power plant are shown in Table P2-4. If the power plant will pay $8.00 per cubic yard of sorted solid waste delivered to the plant, where should the solid-waste site be located? Use the city’s viewpoint and assume that 200,000 cubic yards of refuse will be hauled to the plant for one year only. One site must be selected.
- Need help with parts d and k. Data: TSERofReturn AcmeRofReturn 1 0.42478 -0.48194 2 1.61213 -0.73284 3 -0.98754 -2.28445 4 -0.30013 -1.55312 5 1.41215 0.68674 6 0.68725 -1.31132 7 0.03733 -0.83295 8 -1.72494 -1.71975 9 0.33729 1.14443 10 -1.07502 -1.79885 11 0.86222 0.89736 12 1.17468 1.66664 13 -0.38761 -0.02658 14 1.66212 0.9086 15 1.09969 1.99935 16 -0.06266 0.46148 17 -1.96241 -1.41004 18 -1.32499 -0.38086 19 -1.51247 -1.90904 20 0.74974 0.91873 21 -0.38761 -0.49714 22 -0.17514 -1.31385 23 -3.41222 -1.15681 24 -0.01266 2.11718 25 0.16231 1.78766 26 -0.82506 1.30344 27 -0.41261 -0.43377 28 0.2623 -1.70274 29 -1.16251 0.4692 30 -1.05003 0.27671 31 -0.65008 -0.63741 32 0.62475 2.9895 33 -0.68758 1.3613 34…Cell Phone Radiation Listed below are the measured radiation absorption rates (in W/kg) corresponding to these cell phones: iPhone 5S, BlackBerry Z30, Sanyo Vero, Optimus V, Droid Razr, Nokia N97, Samsung Vibrant, Sony Z750a, Kyocera Kona, LG G2, and Virgin Mobile Supreme. The data are from the Federal Communications Commission. If one of each model of cell phone is measured for radiation and the results are used to find the measures of variation, are the results typical of the population of cell phones that are in use?What size samples do you need for a 2-group design if you expect to have an effect size of .50 and you want your power to be .71?
- Exercise 1.14 (Static) THE BANK CUSTOMER WAITING TIME CASE A bank manager has developed a new system to reduce the time customers spend waiting to be served by tellers during peak business hours. Typical waiting times during peak business hours under the current system are roughly 9 to 10 minutes. The bank manager hopes that the new system will lower typical waiting times to less than 6 minutes and wishes to evaluate the new system. When the new system is operating consistently over time, the bank manager decides to select a sample of 100 customers that need teller service during peak business hours. Specifically, for each of 100 peak business hours, the first customer that starts waiting for teller service at or after a randomly selected time during the hour will be chosen. Consider the peak business hours from 2:00 p.m. to 2:59 p.m., from 3:00 p.m. to 3:59 p.m., from 4:00 p.m. to 4:59 p.m., and from 5:00 p.m. to 5:59 p.m. on a particular day. Also, assume that a computer software…A shoe wholesaler wants to optimize its shipment of shoes to its client retailers. To minimize their turnover time and avoid building up stocks that add costs, the wholesaler wants to know if weather conditions are important in determining the type of shoe demanded. Specifically, she / he would like to know if high temperatures affect the sale of closed, rubber-heeled walking shoes. He / she has the relevant data showing the temperature recorded at the location of its retail shops, as well as their record of sales of these walking shoes, during each day of the past year. What type of analysis should he / she conduct? What variables should be considered? Explain.Obtain the appropriate measure of dispersion for age and both income variables. DATA Subject Gender Marital Status Age Education Household Income Personal Income 1 F 1 30 0 70000.00 40000.00 2 F 0 40 0 32500.00 32500.00 3 M 1 45 0 42000.00 .0 4 M 1 23 0 50000.00 50000.00 5 M 0 50 0 4500.00 4500.00 6 F 0 65 1 40000.00 22000.00 7 F 1 33 1 12000.00 12000.00 8 F 0 20 2 56000.00 52000.00 9 F missing 30 3 17500.00 17500.00 10 M 1 Missing 4 44000.00 39000.00 11 M 2 58 1 missing missing 12 M 2 32 2 10000.00 10000.00 13 M 1 35 3 missing missing 14 F 2 23 4 100000.00 50000.00 15 F 2 34 1 64000.00 64000.00 16 M 1 26 2 Missing missing 17 M 1 36 3 missing missing 18 F 0 41 4 7500.00 5500.00 19…

