Suppose you are conducting a study about how the average U.S. worker spends time over the course of a workday. You are interested in how much time workers spend per day on personal calls, e-mails, and social networking websites, as well as how much time they spend socializing with coworkers versus actually working. The most recent census provides data for the entire population of U.S. workers on variables such as travel time to work, time spent at work, and break time at work. The census, however, does not include data on the variables you are interested in, so you obtain a random sample of 82 full-time workers in the United States and ask about personal calls, e-mails, and so forth. You are curious about how your sample compares with the census, so you also ask the workers the same questions about work that are asked in the census. Suppose the mean break time per day from the most recent census is 29.6 minutes, with a standard deviation of 16.0 minutes. Your sample of 82 U.S. workers provides a mean break time per day of 31.9 minutes with a sample standard deviation of 22.4 minutes. Organize this information by matching the information in this table with the matching choices below: u= Choice 1 o = Choice 2 M = Choice 4 s = Choice 5 OM = Choice 3 SM = Choice 6
Suppose you are conducting a study about how the average U.S. worker spends time over the course of a workday. You are interested in how much time workers spend per day on personal calls, e-mails, and social networking websites, as well as how much time they spend socializing with coworkers versus actually working. The most recent census provides data for the entire population of U.S. workers on variables such as travel time to work, time spent at work, and break time at work. The census, however, does not include data on the variables you are interested in, so you obtain a random sample of 82 full-time workers in the United States and ask about personal calls, e-mails, and so forth. You are curious about how your sample compares with the census, so you also ask the workers the same questions about work that are asked in the census. Suppose the mean break time per day from the most recent census is 29.6 minutes, with a standard deviation of 16.0 minutes. Your sample of 82 U.S. workers provides a mean break time per day of 31.9 minutes with a sample standard deviation of 22.4 minutes. Organize this information by matching the information in this table with the matching choices below: u= Choice 1 o = Choice 2 M = Choice 4 s = Choice 5 OM = Choice 3 SM = Choice 6

Glencoe Algebra 1, Student Edition, 9780079039897, 0079039898, 2018
18th Edition
ISBN:9780079039897
Author:Carter
Publisher:Carter
Chapter10: Statistics
Section10.6: Summarizing Categorical Data
Problem 27PPS

Related questions

Concept explainers
Contingency Table
A contingency table can be defined as the visual representation of the relationship between two or more categorical variables that can be evaluated and registered. It is a categorical version of the scatterplot, which is used to investigate the linear relationship between two variables. A contingency table is indeed a type of frequency distribution table that displays two variables at the same time.
Binomial Distribution
Binomial is an algebraic expression of the sum or the difference of two terms. Before knowing about binomial distribution, we must know about the binomial theorem.
Topic Video
Question
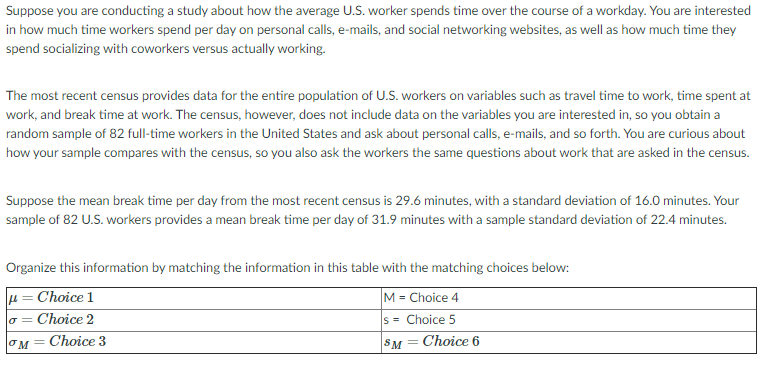
Transcribed Image Text:Suppose you are conducting a study about how the average U.S. worker spends time over the course of a workday. You are interested
in how much time workers spend per day on personal calls, e-mails, and social networking websites, as well as how much time they
spend socializing with coworkers versus actually working.
The most recent census provides data for the entire population of U.S. workers on variables such as travel time to work, time spent at
work, and break time at work. The census, however, does not include data on the variables you are interested in, so you obtain a
random sample of 82 full-time workers in the United States and ask about personal calls, e-mails, and so forth. You are curious about
how your sample compares with the census, so you also ask the workers the same questions about work that are asked in the census.
Suppose the mean break time per day from the most recent census is 29.6 minutes, with a standard deviation of 16.0 minutes. Your
sample of 82 U.S. workers provides a mean break time per day of 31.9 minutes with a sample standard deviation of 22.4 minutes.
Organize this information by matching the information in this table with the matching choices below:
u = Choice 1
M = Choice 4
Choice 2
s = Choice 5
lo=
Choice 3
Choice 6
SM =
Expert Solution
This question has been solved!
Explore an expertly crafted, step-by-step solution for a thorough understanding of key concepts.

This is a popular solution!

Trending now
This is a popular solution!

Step by step
Solved in 2 steps

Knowledge Booster


Learn more about
Need a deep-dive on the concept behind this application? Look no further. Learn more about this topic, statistics and related others by exploring similar questions and additional content below.Recommended textbooks for you
Glencoe Algebra 1, Student Edition, 9780079039897…
Algebra
ISBN:
9780079039897
Author:
Carter
Publisher:
McGraw Hill

Holt Mcdougal Larson Pre-algebra: Student Edition…
Algebra
ISBN:
9780547587776
Author:
HOLT MCDOUGAL
Publisher:
HOLT MCDOUGAL

Big Ideas Math A Bridge To Success Algebra 1: Stu…
Algebra
ISBN:
9781680331141
Author:
HOUGHTON MIFFLIN HARCOURT
Publisher:
Houghton Mifflin Harcourt
Glencoe Algebra 1, Student Edition, 9780079039897…
Algebra
ISBN:
9780079039897
Author:
Carter
Publisher:
McGraw Hill
Holt Mcdougal Larson Pre-algebra: Student Edition…
Algebra
ISBN:
9780547587776
Author:
HOLT MCDOUGAL
Publisher:
HOLT MCDOUGAL
Big Ideas Math A Bridge To Success Algebra 1: Stu…
Algebra
ISBN:
9781680331141
Author:
HOUGHTON MIFFLIN HARCOURT
Publisher:
Houghton Mifflin Harcourt