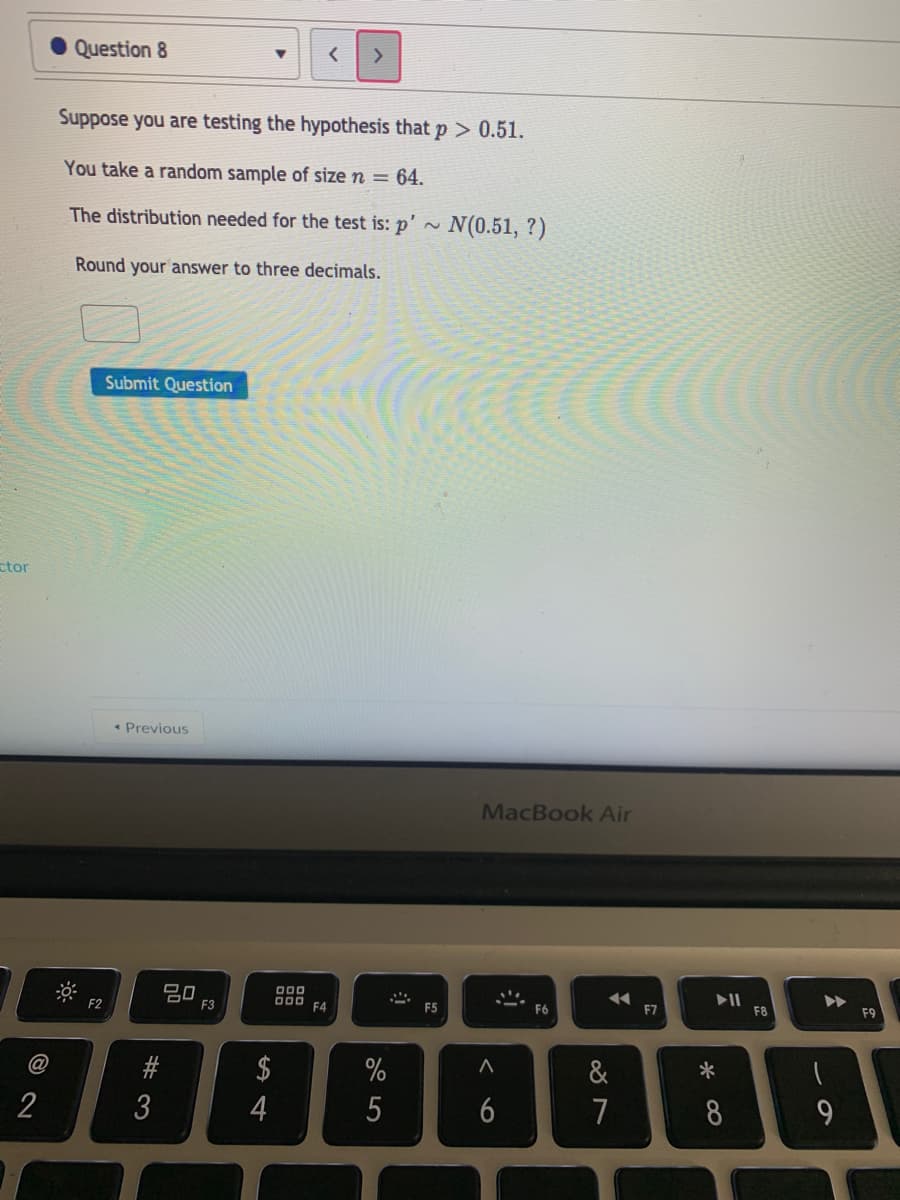
Suppose you are testing the hypothesis that p > 0.51. You take a random sample of size n = 64. The distribution needed for the test is: p'~ N(0.51, ?) Round your answer to three decimals.
Q: If one score is randomly selected from a normal distribution with µ = 100 and σ = 20, the…
A: The formula for z score is, Here µ is the mean and σ is the standard deviation. The…
Q: The U.S. Geological Survey compiled historical data about Old Faithful Geyser (Yellowstone National…
A: Solution:From the given information, the first sample size is 9,800 observations; sample mean is…
Q: 4. For 10 randomly selected customers, find the probability that exactly 3 customers whose hair cut…
A: It is an application of uniform distribution . It is widely used in statistics .
Q: 23% of the birds in Cititon Park are blue. What is the probability that, in a random sample of 163…
A: Given that
Q: The compressive strength of concrete is normally distributed with mean 2500 psi and standard 50 psi.…
A:
Q: The U.S. Geological Survey compiled historical data about Old Faithful Geyser (Yellowstone National…
A: From the given information, the first sample size is 9,360 observations; sample mean is 62.2…
Q: 12% of the squirrels in Cititon Park are gray. What is the probability that, in a random sample of…
A: Given: n=479p=0.12 Use normal approximation with mean μ and standard deviation σ. μ=np =479*0.12…
Q: A researcher claims that a post-lunch nap decreases the amount of time it takes males to sprint 20…
A:
Q: A random sample of size 36 is taken from a population that is normal. Given that the population mean…
A:
Q: Let x be a continuous random variable that has a normal distribution with μ = 67 and = 18. Assuming…
A: The mean and standard deviation are 67 and 18, respectively.
Q: The U.S. Geological Survey compiled historical data about Old Faithful Geyser (Yellowstone National…
A: From the provided information,
Q: The U.S. Geological Survey compiled historical data about Old Faithful Geyser (Yellowstone National…
A:
Q: Approximate the mean of the random variable X based on the simulation for 25 games. hits (Round to…
A: Given , the numbers of hits for 25 games in table, 0 0 1 1 0 5 4 3 0 1 2 2 1 2 3 1 1 1 1 1…
Q: Approximate the mean of the random variable X based on the simulation for 50 games. x* hits (Round…
A: We have given that data Sample size n =50 Mean = sum of all observations/total number of…
Q: the duration of a particular type of criminal trial is known to be normally distributed with a mean…
A: (a) X : The duration of a particular type of criminal trial.
Q: A researcher claims that a post-lunch nap decreases the amount of time it takes males to sprint 20…
A: Since, the samples are dependent and population standard deviation for the true difference in mean,…
Q: Based on an analysis of sample data, an article proposed the pdf fx) = 0.55e0.5sx - 1) when x2 1 as…
A: The given density function is, fx=0.55e-0.55x-1, x≥1 a). The probability that waiting is at most 2…
Q: Let x be a continuous random variable that is normally distributed with a mean of 65 and a standard…
A: Solution: From the given information, X follows normal distribution with mean µ=65 and a standard…
Q: 17% of the birds in Cititon Park are blue. What is the probability that, in a random sample of 141…
A: We have to find given probability..
Q: Q2 Let random variable XX be the hair cut time of customer in one hair salon, and XXfollows uniform…
A: As we are authorized to answer only 3 subparts for each question and that you haven't specified…
Q: The U.S. Geological Survey compiled historical data about Old Faithful Geyser (Yellowstone National…
A: The 99% confidence interval for μ1 – μ2 is obtained below: From the given information, the sample…
Q: The total cholesterol levels for women aged 20 to 30 years are normally distributed with μ=190 mg/dl…
A: Given : μ = 190 σ = 40 n = 25 μx¯ = 190 σx¯ = 4025 σx¯ = 8 α = 0.01 central area 0.99 Zα2 = Z0.005 =…
Q: The U.S. Geological Survey compiled historical data about Old Faithful Geyser (Yellowstone National…
A: Given: x¯1=61.4x¯2=72.4σ1=8.70σ2=12.55n1=9140n2=25106 Let μ1 be the population mean of x1 and let μ2…
Q: The total cholesterol levels for women aged 20 to 30 years are normally distributed with µ=190 mg/dl…
A: The sample size is 25 that is reasonably large. Therefore, z-test can be used here. Let µ be the…
Q: he U.S. Geological Survey compiled historical data about Old Faithful Geyser (Yellowstone National…
A: Solution: Given information: n1=8820 Sample size of old faithful eruption for the years 1948 to…
Q: 22% of the birds in Cititon Park are blue. What is the probability that, in a random sample of 329…
A:
Q: 35% of the squirrels in Cititon Park are gray. What is the probability that, in a random sample of…
A: Given that Sample size n =35 Population proportion p=35%=0.35
Q: The U.S. Geological Survey compiled historical data about Old Faithful Geyser (Yellowstone National…
A: We have given that Sample size n1= 8860 , n2= 24170 , Sample mean x1= 61.4 , x2= 70.6 , sigma1=…
Q: 25% of the squirrels in Cititon Park are gray. What is the probability that, in a random sample of…
A:
Q: From the past experience, 60% of the stocks are profitable. What is the probability that 5of the 7…
A:
Q: Let x1 be a random variable that represents the time interval (in minutes) between Old Faithful…
A: Given : Let x1 be a random variable that represents the time interval (in minutes) between Old…
Q: The U.S. Geological Survey compiled historical data about Old Faithful Geyser (Yellowstone National…
A: Given information- We have given two independent populations. n1 = 9060, X1-bar = 62.4 minutes, σ1 =…
Q: A researcher claims that a post-lunch nap decreases the amount of time it takes males to sprint 20…
A:
Q: A sample of n = 4 scores is selected from a population with µ = 30 and s = 8. The probability of…
A: From the given information, the population mean is 30 and standard deviation is 8. The sample size…
Q: he U.S. Geological Survey compiled historical data about Old Faithful Geyser (Yellowstone National…
A:
Q: In Europe, 53% of the flowers of the Rewardless Orchid, Dactylorhiza sambucina, are yellow, whereas…
A: It has been given that 53% of the flowers of the reward less Orchid, Dactylorhiza sambucina, are…
Q: a random sample of n = 36 students who registered for Introductory Psychology is placed in the…
A: Given, sample size, n=36 sample mean score, M=76 mean score of general population of…
Q: 36% of the birds in Cititon Park are blue. What is the probability that, in a random sample of 67…
A: We have given that Sample size n =67 Success of probability p =36%=0.36
Q: The average cost of a smartphone in North America is $518 with a standard deviation of $13. Consider…
A:
Q: A researcher claims that a post-lunch nap decreases the amount of time it takes males to sprint 20…
A: The Paired sample t-test , sometimes called the dependent sample t-test, is a statistical procedure…
Q: 16% of the squirrels in Cititon Park are gray. What is the probability that, in a random sample of…
A:
Q: Let x be a continuous random variable that is normally distributed with a mean of 58 and a standard…
A: Given that, Mean = 58 Standard deviation = 17
Q: A researcher claims that a post-lunch nap decreases the amount of time it takes males to sprint 20…
A:
Q: The U.S. Geological Survey compiled historical data about Old Faithful Geyser (Yellowstone National…
A: Since, you have asked multiple question, we will solve the first question for you. If you want any…
Q: The U.S. Geological Survey compiled historical data about Old Faithful Geyser (Yellowstone National…
A:
Q: st 66 percent of young adults aged 18 to 24 years have always believed the world is round, people…
A: A. Given: n=578 p=0.66 Now, np = 578* 0.66=381.48 > 5 (Greater than 5) n(1-p) =…
Q: Business Weekly conducted a survey of recent graduates from the top MBA programs. On the basis of…
A:
Q: 40% of the squirrels in Cititon Park are gray. What is the probability that, in a random sample of…
A: Given that P = 0.40 q= 1 - p = 1 - 0.40 = 0.60 n = 232 Using binomial distribution Mean = mu =…
Q: The U.S. Geological Survey compiled historical data about Old Faithful Geyser (Yellowstone National…
A: The 95% C.I. for µ1- µ2 is given as follows: C.I. = x1¯-x2¯±Zɑ/2σ12n1+σ22n2Where,x1¯-x2¯ is the…
Q: A researcher claims that a post-lunch nap decreases the amount of time it takes males to sprint 20…
A: The paired sample t-test, sometimes called the dependent sample t-test, is a statistical procedure…
Step by step
Solved in 2 steps
- We want to conduct a hypothesis test of the claim that the population mean score on a nationwide examination in biology is different from 506 . So, we choose a random sample of exam scores. The sample has a mean of 489 and a standard deviation of 78. For each of the following sampling scenarios, choose an appropriate test statistic for our hypothesis test on the population mean. Then calculate that statistic. Round your answers to two decimal places. , and it is from a non-normally distributed population with a known standard deviation of a. The sample has a size of 100 and it is from a non-normally distributed population with a known standard deviation of 78 z=? t=? it is unclear which statistics test to use? b. The sample has size 19, and it is from a normally distributed population with an unknown standard deviation. z=? t=? it is unclear which statistics test to use?We want to conduct a hypothesis test of the claim that the population mean score on a nationwide examination in anthropology is different from 481. So, we choose a random sample of exam scores. The sample has a mean of 488 and a standard deviation of 75. For each of the following sampling scenarios, choose an appropriate test statistic for our hypothesis test on the population mean. Then calculate that statistic. Round answer to 2 decimal places. (a) The sample has size 16, and it is from a normally distributed population with a known standard deviation of 77. z= t= or it is unclear which test statistic to use. (b) The sample has size 18, and it is from a normally distributed population with an unknown standard deviation. z= t= or it is unclear which test statistic to use.The number of bacteria in a 1 mL solution follows a Poisson distribution with mean equal to 4.5. What is the chance of observing at least 5 bacteria in a 0.5 mL solution? Define the random variable and its distribution. Compute for the variable or measure asked for. Show your solution and round off your final answers to four decimal places. Random Variable: Distribution: Computation:
- True or False: Let X be the number of 3's in 8 rolls of a 6-faced fair die. X can be approximated as a Poisson random variable.(with explanations)We want to conduct a hypothesis test of the claim that the population mean score on a nationwide examination in anthropology is different from 522. So, we choose a random sample of exam scores. The sample has a mean of 503 and a standard deviation of 76 For each of the following sampling scenarios, choose an appropriate test statistic for our hypothesis test on the population mean. Then calculate that statistic. Round your answers to two decimal places. The sample has size 13,and it is from a normally distributed population with an unknown standard deviation. z= t= =zThe score in the final statistics exam is distributed as a normal random variable with mean of 72 and standard deviation of 7 points. Determine: If a sample of 10 students is taken, deteremine the probability that the mean sample score is greater than 75 is: (use 4 decimal places)
- A new drug, Drug X, is being tested in a clinical trial to treat patients with high blood pressure. To determine the effectiveness of Drug X, 100 patients are randomly selected and their blood pressure, in millimeters of Hg, are recorded. They are then prescribed with the drug for 10 weeks. After 10 weeks, their blood pressure is recorded again. Which of the following would be the BEST test to use on this type of scenario, assuming the assumptions are met? Two independent sample proportion z-test Chi-square test of homogeneity Analysis of Variance (ANOVA) Paired t-test Chi-square test of independence Two independent sample mean t-testWe want to conduct a hypothesis test of the claim that the population mean score on a nationwide examination in biology is different from 535. So, we choose a random sample of exam scores. The sample has a mean of 516 and a standard deviation of 76. For each of the following sampling scenarios, choose an appropriate test statistic for our hypothesis test on the population mean. Then calculate that statistic. Round your answers to two decimal places. (a) The sample has size 13, and it is from a normally distributed population with a known standard deviation of 75. Z = t = (or) : It is unclear which test statistic to use. (b) The sample has size 11, and it is from a normally distributed population with an unknown standard deviation. z = t = (or) It is unclear which test statistic to use.We want to conduct a hypothesis test of the claim that the population mean number of holding penalties during a college football game is less than 2.4penalties per game. So, we choose a random sample of games. The sample has a mean of 2.5penalties per game and a standard deviation of 0.8 penalties per game. For each of the following sampling scenarios, choose an appropriate test statistic for our hypothesis test on the population mean. Then calculate that statistic. Round your answers to two decimal places. (a) The sample has size 100and it is from a non-normally distributed population with a known standard deviation of 0.69. O Z O T O It is unclear which test statistic to use. (b) The sample has size 18, and it is from a population with a distribution about which we know very little. O Z = O t = O It is unclear which test statistic to use
- We want to conduct a hypothesis test of the claim that the population mean germination time of strawberry seeds is different from 17.8 days. So, we choose a random sample of strawberries. The sample has a mean of 18 days and a standard deviation of 1.1 days. For each of the following sampling scenarios, choose an appropriate test statistic for our hypothesis test on the population mean. Then calculate that statistic. Round answer to 2 decimal places. (a) The sample has size 14, and it is from a normally distributed population with an unknown standard deviation. z= t= or it is unclear which test statistic to use. (b) The sample has size 13, and it is from a normally distributed population with a known standard deviation of 0.9. z= t= or it is unclear which test statistic to use.We want to conduct a hypothesis test of the claim that the population mean score on a nationwide examination in anthropology is different from 493. So, we choose a random sample of exam scores. The sample has a mean of 491 and a standard deviation of 74. For each of the following sampling scenarios, choose an appropriate test statistic for our hypothesis test on the population mean. Then calculate that statistic. Round your answers to two decimal places. (a) The sample has size 20, and it is from a normally distributed population with a known standard deviation of 76 (b) the sample has size 16, and it is from a normally distributed population with an unknown standard deviation.Records indicate that the mean weight of mature rainbow trout in Eagle Creek is 2.25 kg with a standard deviation of 0.53 kg. After years of marked oxygen depletion from pollutants in the creek, you want to perform a hypothesis test to see if the standard deviation, σ, of weights has changed. To do so, you measure the weights of 16 randomly chosen mature rainbow trout from the creek and find that the sample standard deviation is 0.34 kg. Under the assumption that current weights of mature rainbow trout in the creek follow a normal distribution, you will perform a chi-square test.Find χ2, the value of the test statistic for your chi-square test. Round your answer to three or more decimal places.=χ2