What are the null and altemative hypotheses? Pno carper versus H, Ppe Caloulate the test statistic, 6-O Round to beo decimal places as needed) Now fnd he crtical value. Select the comect choice below and filin the answer box within your choice. (Round to three decimal places as needed) Do carpeted rooms have more bacteria than uncarpeted rooms at the a001 level of significance? OA Yes, because the lest statistic is not in the ortical region. OB. No, because the test statistic isin the oritical region OC. No, because the lest statisticis not in the ortical region OD. Yes, because the test statistic is in the critical region.
What are the null and altemative hypotheses? Pno carper versus H, Ppe Caloulate the test statistic, 6-O Round to beo decimal places as needed) Now fnd he crtical value. Select the comect choice below and filin the answer box within your choice. (Round to three decimal places as needed) Do carpeted rooms have more bacteria than uncarpeted rooms at the a001 level of significance? OA Yes, because the lest statistic is not in the ortical region. OB. No, because the test statistic isin the oritical region OC. No, because the lest statisticis not in the ortical region OD. Yes, because the test statistic is in the critical region.

Glencoe Algebra 1, Student Edition, 9780079039897, 0079039898, 2018
18th Edition
ISBN:9780079039897
Author:Carter
Publisher:Carter
Chapter10: Statistics
Section: Chapter Questions
Problem 22SGR

Related questions
Question
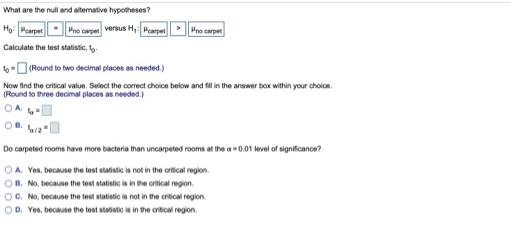
Transcribed Image Text:What are the null and altemative hypotheses?
Họ: Pcarpet Pno carpet versus H, Pcarpet Pno carpet
Calculate the test statistic, ty-
6-O (Round to two decimal places as needed.)
Now find the critical value. Select the correct choice below and fil in the answer box within your choloe.
(Round to three decimal places as needed.)
Do carpeted rooms have more bacteria than uncarpeted rooms at the a0.01 level of significance?
OA. Yes, because the test statistic is not in the oritical region.
OB. No, because the test statistic is in the critical region.
OC. No, because the test statistic is not in the critical region.
OD. Yes, because the tost statistic is in the critical region.
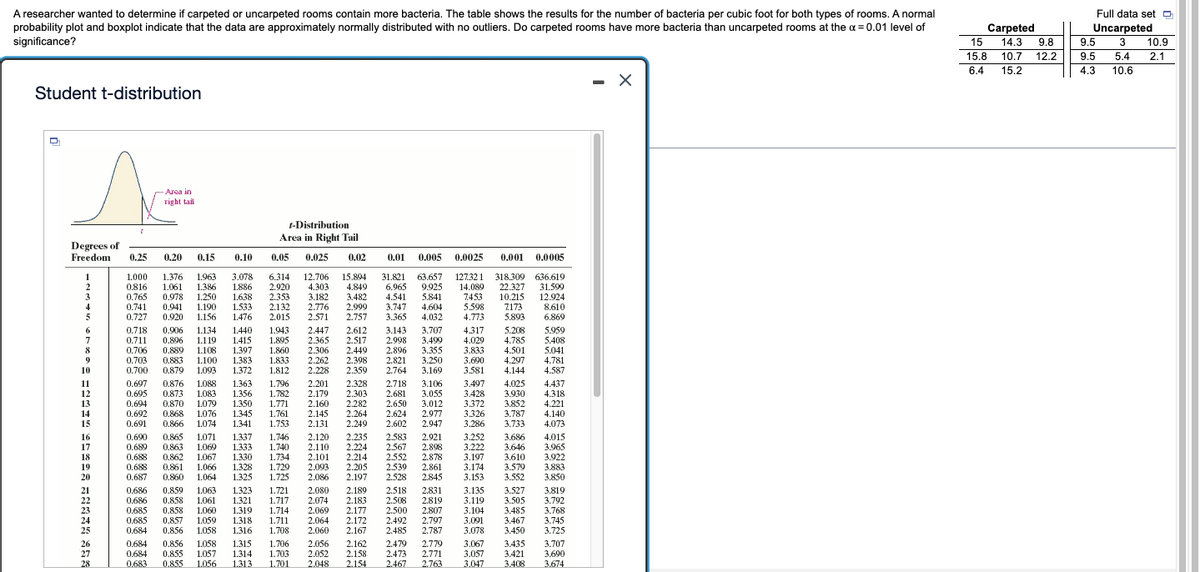
Transcribed Image Text:A researcher wanted to determine if carpeted or uncarpeted rooms contain more bacteria. The table shows the results for the number of bacteria per cubic foot for both types of rooms. A normal
probability plot and boxplot indicate that the data are approximately normally distributed with no outliers. Do carpeted rooms have more bacteria than uncarpeted rooms at the a = 0.01 level of
significance?
Full data set O
Carpeted
14.3
9.8
10.7 12.2
Uncarpeted
9.5
9.5
10.9
2.1
15
3
15.8
5.4
6.4
15.2
4.3
10.6
- X
Student t-distribution
Area in
right tail
t-Distribution
Area in Right Tail
Degrees of
Freedom
0.25
0.20
0.15
0.10
0.05
0.025
0.02
0.01
0.005
0.0025
0.001
0.0005
1.000
0.816
0.765
0.741
1.376
1.061
0.978
0.941
0.920
1.963
1.386
1.250
1.190
1.156
3.078
1.886
1.638
1.533
6.314
2.920
2.353
2.132
12.706
4.303
3.182
2.776
2.571
15.894
4.849
3.482
2.999
2.757
31.821
6.965
4.541
3.747
3.365
63.657
9.925
5.841
4.604
4.032
127.32 1
14.089
7453
5.598
318.309 636.619
31.599
12.924
8.610
6.869
22.327
10.215
3.
7173
5.893
5
0.727
1.476
2.015
4.773
1.943
1.895
1.860
1.833
1.812
2.612
4.317
5.959
6
7
8
0.718
0.711
0.706
0.703
0.700
0.906
0.896
0.889
0.883
0.879
1.134
1.119
1.108
1.100
1.093
1.440
1.415
1.397
1.383
2.447
2.365
2.306
2.262
2.228
2.517
2.449
2.398
2.359
3.143
2.998
2.896
2.821
2.764
3.707
3.499
3.355
3.250
3.169
4.029
3.833
3.690
3.581
5.208
4.785
4.501
4.297
5.408
5.041
4.781
4.587
10
1.372
4.144
11
12
13
14
15
0.697
0.695
0.694
0.692
0.691
0.876
0.873
0.870
0.868
0.866
1.088
1.083
1.079
1.076
1.074
1.363
1.356
1.350
1.345
1.341
1.796
1.782
1.771
1.761
1.753
2.201
2.179
2.160
2.145
2.131
2.328
2.303
2.282
2.264
2.249
2.718
2.681
2.650
2.624
2.602
3.106
3.055
3.012
2.977
2.947
3.497
3.428
3.372
3.326
3.286
4.025
3.930
3.852
3.787
3.733
4.437
4.318
4.221
4.140
4.073
16
17
18
19
20
0.690
0.689
0.688
0.688
0.687
0.865
0.863
0.862
0.861
0.860
1.071
1.069
1.067
1.066
1.064
1.337
1.333
1.330
1.328
1.325
1.746
1.740
1.734
1.729
1.725
2.120
2.110
2.101
2.093
2.086
2.235
2.224
2.214
2.205
2.197
2.583
2.567
2.552
2.539
2.528
2.921
2.898
2.878
2.861
2.845
3.252
3.222
3.197
3.174
3.153
3.686
3.646
3.610
3.579
3.552
4.015
3.965
3.922
3.883
3.850
21
22
0.686
0.686
0.685
0.685
0.684
0.859
0.858
0.858
0.857
0.856
1.063
1.061
1.060
1.059
1.058
1.323
1.321
1.319
1.318
1.316
1.721
1.717
1.714
1.711
1.708
2.080
2.074
2.069
2.064
2.060
2.189
2.183
2.177
2.172
2.167
2.518
2.508
2.500
2.492
2.485
2.831
2.819
2.807
2.797
2.787
3.135
3.119
3.104
3.091
3.078
3.527
3.505
3.485
3.467
3.450
3.819
3.792
3.768
3.745
3.725
26
27
28
0.684
0.684
0.683
0.856
0.855
0.855
1.058
1.057
1.056
1.315
1.314
1.313
1.706
1.703
1.701
2.056
2.052
2.048
2.162
2.158
2.154
2.479
2.473
2.467
2.779
2.771
2.763
3.067
3.057
3.047
3.435
3.421
3.408
3.707
3.690
3.674
Expert Solution
This question has been solved!
Explore an expertly crafted, step-by-step solution for a thorough understanding of key concepts.

Step by step
Solved in 2 steps with 3 images

Recommended textbooks for you
Glencoe Algebra 1, Student Edition, 9780079039897…
Algebra
ISBN:
9780079039897
Author:
Carter
Publisher:
McGraw Hill
Glencoe Algebra 1, Student Edition, 9780079039897…
Algebra
ISBN:
9780079039897
Author:
Carter
Publisher:
McGraw Hill