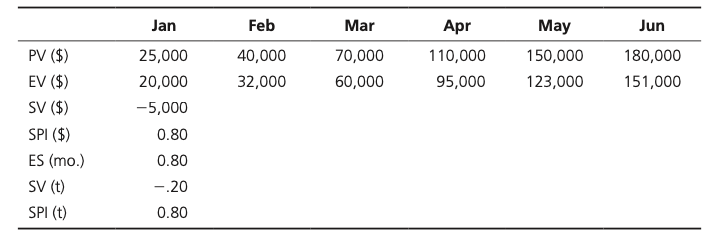
Suppose you have a project with a Budget at Completion (BAC) of $250,000 and a projected length of 10 months. After tracking the project for six months, you have collected the information in the table below. a. Complete the table. How do Earned Value SPI (based on $) and Earned Schedule SPI differ? b. Calculate the schedule variances for the project for both Earned Value and Earned Schedule. How do the values differ?


Q: 1- Total project finishing time. 2- Critical path 3- Free float for each task. • 4- If Activity B is…
A: The critical path method is a project management technique that identifies the sequence of tasks…
Q: The following represents a project with known activity times. All times are in weeks. Activity…
A: Critical path, Total float, Free float, Independent float A - 4 B - 3 C A 2 D B 7 E C, D…
Q: 13.39 Activity A is worth $500, is complete, and actually cost $500. Activity B is worth $1.000, is…
A: Earned Value (EV) is the sum of percentage completed multiplied by the task budget. The calculation…
Q: 1- Total project finishing time 2- Critical path, 3- Free float for each task. • 4- If Activity B is…
A: The critical path is the path with the longest duration.
Q: The following six activities constitute an overall bar chart portrayal of 4-month project. Two…
A: This question is related to the topic of Project Management and this topic falls under the…
Q: The new director of special events at a large university has decided to completely revamp graduation…
A: Given data is
Q: a. Draw a project network. b. What is the critical path? c. What is the normal project cost? d.…
A: Find the Slope calculations below:
Q: Examine briefly each of the purposes of project scheduling.
A: In any project, whether it is construction, finance, institutional, etc. its scheduling is as…
Q: The following represents a project with known activity times. All times are in weeks. Activity…
A: Given that: Activity Immediate Predecessors Duration A - 4 B - 3 C A 2 D B 7 E C, D 4…
Q: Three recent college graduates have formed a partnership and have opened an advertising firm. Their…
A: Precedence DiagramThe precedence diagram is as shown in the diagram below:
Q: 2. As project manager, you need to reduce the project duration as requested by the client. To make…
A: Given data is
Q: Dave Fletcher was able to determine the activity times for constructing his laser scanning machine.…
A: Network diagram:
Q: To create a project schedule, one must understand the Project Schedule Management processes; in…
A: Develop Schedule: It is the process of analyzing the activity sequences, durations, resource…
Q: Why are a forward pass and a backward pass needed toproduce a project schedule?
A: Project management is the process of putting processes, techniques, skills, information, and…
Q: Q1: Draw the allocation of resources chart on the earliest and latest start time for the project…
A: In given network diagram critical path will pass the activities B−E−G−K duration of the…
Q: 11. Building a backyard swimming pool consists of nine major activities. The activities and their…
A: As you have posted multiple questions, we will provide the answers to the first question. Kindly…
Q: (c) Compute the earliest start, earliest finish, latest start and latest finish time and the slack…
A: Project network is the graphical representation of project activities and their duration to complete…
Q: (1) Construct a network diagram showing the various logical activity relationships from this…
A: A project schedule network diagram shows the sequential and analytical connection between tasks in a…
Q: Solve the following project by hand and submit your notes: Activity Normal Time (weeks) Crash…
A: NOTE: AS PER GUIDELINES, WE ARE ONLY ALLOWED TO DO THREE SUB-PARTS AT A TIME. PLEASE POST THE REST…
Q: The information of a project is shown below. Activity A, 7 days, 13 workers, IP =none Activity B, 3…
A: Activity Duration Immediate Predecessor A 7 - B 3 - C 4 - D 3 A E 6 B F 8 C
Q: Who creates the project schedule?
A: Project scheduling refers to creating a schedule containing the activities, milestones, and…
Q: a. Draw the precedence diagram. b. What is the probability that the project can be completed in 24…
A: A project schedule network diagram shows the sequence of the task that are performed to complete a…
Q: Please Answer the following questions: - How does earned value give a clearer picture of project…
A: 1.) An Earned value helps in linking actual cost as well as schedule cost with the planned cost in…
Q: I need assistance with the following questions in: Project Scheduling. This is a follow up to a…
A: Given the activity sequence and timings the following are the paths (in AOA notation):A-D (length…
Q: Early Start, Early Finish, Late Start, Late Finish, Duration, Float Below is a project listed in a…
A: Given- Activity Predecessor Duration (Weeks) A None 5 B A 3 C A 8 D C 13 E B 7 F B 9…
Q: Three recent college graduates have formed a partnership and have opened an advertising firm.Their…
A: Since we only answer up to 3 sub-parts, we'll answer the first 3. Please resubmit the question and…
Q: (a) Construct the AON network for the project. (b) Determine all paths that run from the start to…
A: Activity-on-node is a project management term that directs to a precedence diagramming technique…
Q: I need a detailed explanation and assistance to solve this problem: A company decides to plan a…
A: Drawing the project network as shown in the diagram using AOA convention we represent the activities…
Q: If the first activity in a given project is D which precedes A, B. And activity A precedes H,G. And…
A: Note: - Since we can answer only up to three subparts we will answer the first three subparts(1, 2,…
Q: (i) Construct a network diagram showing the various logical activity relationships from this…
A: For each activity, we have immediate predecessor data and Time in days, using the above table,…
Q: How can we determine the probability that a project will be completed by a certain date? What…
A: PERT: it stands for Project Evaluation and Review Technique. It shows the network of the project by…
Q: cts to implement in project man
A: To be a good project manager, one must have a wide range of abilities. It requires a variety of…
Q: i. Draw the network of the project. ii. Determine the slack/floats of each sensitivity iii. As a…
A: THE ANSWER IS AS BELOW:
Q: Part 1: Building a backyard swimming pool consists of nine major activities. The activities and…
A: From the given data the network diagram is drawn below-
Q: A.Find the critical path and the entire project completion time. B.Which task has the most slack…
A: Below is the solution:-
Q: Below is the details about a. What is the maximum and minimum human resource that would be required…
A: A network diagram related to the project shows the sequence of the task that is performed to…
Q: NORMAL CRASH TIME NORMAL CRASH COST TIME IMMEDIATE ACTIVITY (WEEKS) (WEEKS) COST PREDECESSOR(S) A 4…
A: Answer: we can see that for the mentioned project there are seven activities A, B, C, D, E, F, G. In…
Q: The fo llowing is a table of activities associated with a project at Rafay lshfaq's software firm in…
A: Note: As per the Bartleby guidelines only the first three parts have been answered. AOA ( Arrow to…
Q: Project ALPHA has 6 activities from A to F as follows: Activity Duration Preceded By A A A B E F E…
A: Answer: A as A is the merged activity of the correct network diagram.
Q: After the first month of a project, the Actual Cost was $400 and the planned cost for the first…
A: Given, Actual cost, AC= $400 Planned cost or Budget, BAC = $500 Work complete= 50% a) Cost…
Q: Given the activities of a project, their time estimates, and their immediate predecessors shown…
A: Given information Activity Activity Time Immediate predecessors A 2 B 3 C 2 A D 4…
Q: If the first activity in a given project is D which precedes A, B. And activity A precedes H,G. And…
A: Given data is
Q: Part 2: The activity list shown below represents the activities, the job logic and activities'…
A: The AOA network diagram is the graphical representation that represents the activities and their…
Q: 1- Total project finishing time. 2- Critical path 3- Free float for each task. 4- If Activity B is…
A: The critical path method is a project management technique that identifies the sequence of tasks…
Q: The data below represent a project that can be completed at normal cost in 15 days. The project can…
A: Find the Given details below: Activity Predecessor Normal Time (NT) (Days) Crash Time (CT) (Days)…


Trending now
This is a popular solution!

Step by step
Solved in 2 steps with 1 images

- Bad simulations Explain why each of the followingsimulations fails to model the real situation properly:a) Use a random integer from 0 through 9 to representthe number of heads when 9 coins are tossed. b) A basketball player takes a foul shot. Look at a ran-dom digit, using an odd digit to represent a good shot and an even digit to represent a miss.c) Use random numbers from 1 through 13 to represent thedenominations of the cards in a five-card poker hand.An urn contains 10 red balls and 30 blue balls.a Suppose you draw 4 balls from the urn. Let Xi bethe number of red balls drawn on the ith ball (Xi 0 or1). After each ball is drawn, it is put back into the urn. Are the random variables X1, X2, X3, and X4 indepen-dent random variables? b Repeat part (a) for the case in which the balls are notput back in the urn after being drawn.The process of packing 3 16-ounce bottles of Hershey chocolate syrup in super-sized packages like those sold at Sam’s and Costco is an example of:
- You work for a small retail store. You must decide how many cases of kombucha to order. Twenty cases fit on a pallet and because of shipping costs, orders must be placed in multiples of 20. You can either order 20, 40, 60, 80 or 100 cases. Each case costs $15. If you order more than 1 pallet, you receive a discount of 5% per additional pallet ordered (2 pallets would be 5%, 3 would be 10%, etc). The cases can be sold for $25 each. Any that are left unsold can be sold to a discount store for $10. Your records suggest that the probability that you will sell 25 cases is 20%, 45 cases is 45%, 65 cases is 20% and 85 cases is 15%. a) Construct a payoff table to provide reflect the decisions and outcomes What would be your decision based on each of the following? Maximin Maximax Minimax regret Expected value Overall - what would you do? Why?The production function q = 9K0.8L0.1 exhibits [increasing return to scale, constant return to scale, decreasing constant return to scale]In Output 7.1: Is the (Pearson) chi-square statistically significant? Explain what it means. Are the expected values in at least 80% of the cells ≥ 5? How do you know? Why is this important?
- In case of a production company which produces 3 different products (RE1, RE2, RE3), we know the following information: Measuring Unit RE1 RE2 RE3 Quantity unit 3,000,000 4,000,000 5,000,000 Sales Price Euro/unit 2,500 3,000 3,500 Production Cost Euro/unit 1,500 1,500 1,500 Consumption Factor kg/unit 0.02 0.04 0.01 Tasks: a) Has a company scarce resource if the company has only 250 tons raw material? b) Calculate the optimal composition of products! c) Determine the estimated total sales!Lifang Wu owns an automated machine shop that makes precision auto parts. He has just compiled an input—output report for the grinding work center. Period 1 2 3 4 Total Planned input 70 70 85 85 Actual input 75 75 75 75 Deviation Planned output 75 75 75 75 Actual output 85 85 80 80 Deviation Initial backlog: 20 For the given information related to "inputs," the values for deviation and total are: The deviation in period 2 = units (enter your response as an integer, including a minus sign if necessary). Note:- Do not provide handwritten solution. Maintain accuracy and quality in your answer. Take care of plagiarism. Answer completely. You will get up vote for sure.For a particular process, originally each 200 units of product manufactured yielded 180 conforming units, 9 units that must be scrapped, and the remaining units that must be reprocessed. Each scrapped unit results in a $30 loss and each reprocessed unit requires an extra 0.45 hours of processing time. The resource time of producing the original 200 units is 30 hours. As a result of a quality improvement program that was recently introduced, for each 200 units manufactured, the process now yields 190 conforming units, 4 unit to be scrapped, and the remaining units that must be reprocessed. Calculate the productivity (in units per hour) for the original process.
- Lifang Wu owns an automated machine shop that makes precision auto parts. He has just compiled an input —output report for the grinding work center. Period 1 2 3 4 Total Planned input 90 90 95 95 Actual input 95 95 95 95 Deviation Planned output 85 85 85 85 Actual output 85 85 80 80 Deviation Initial backlog: 35 Part 2 For the given information related to "inputs," the values for deviation and total are: The deviation in period 2 = enter your response here units (enter your response as an integer, including a minus sign if necessary). Part 3 The deviation in period 4 = enter your response here units (enter your response as an integer, including a minus sign if…A)What would the model be if the minimum calories were 450? B)What happens to the model if the total Liquid value is 3? C)What happens in the model if the coefficient of the objective function of peanut butter is 8? D)What should be the coefficient of the objective function for the cracker to be the basic variable? None of above less than 5.50 less than 1.43 less than 7.76 less than 6.56 E)What is the objective function value? Please donot provide solution in image format and it should be in step by step format and provide solution asapWhen will you use scatter diagram?a. For 2 variables that have relationshipb. For 2 variables that have no relationshipc. For data that are inversely proportionald. For data that are directly proportionale. None of the above