Suppose you have the following information on whether households have a landline phone or not, broken down by age of “Household Heads.” A sample of 500 households was drawn in each of two communities (a) What is the overall (or “crude”) proportion of households in Community A that had a landline phone? What is the corresponding proportion in Community B? (b) What is the set of age-specific household landline rates for each community – that is, the rate within each age of household head category (<35 and 35+ hours, separately) for each community (A vs. B)? (c) Please compare the age-specific landline rates of Community A vs. Community B and then compare the overall rates of the two communities. Please “make sense” of the two different stories that these two measures imply. Put differently, please “weave” these different results into one explanation that helps us understand landline use rates in these two communities.


Suppose you have the following information on whether households have a landline phone or not, broken down by age of “Household Heads.” A sample of 500 households was drawn in each of two communities
(a) What is the overall (or “crude”) proportion of households in Community A that had a landline phone? What is the corresponding proportion in Community B?
(b) What is the set of age-specific household landline rates for each community – that is, the rate within each age of household head category (<35 and 35+ hours, separately) for each community (A vs. B)?
(c) Please compare the age-specific landline rates of Community A vs. Community B and then compare the overall rates of the two communities. Please “make sense” of the two different stories that these two measures imply. Put differently, please “weave” these different results into one explanation that helps us understand landline use rates in these two communities.
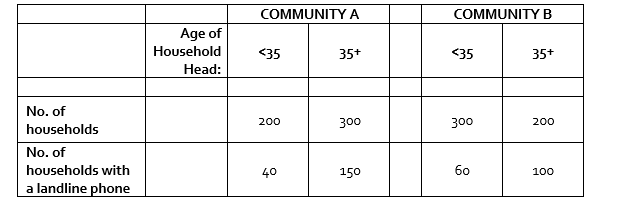
Given data
| Community A | Community B | |||||
| Age of Household Head | <35 | 35+ | <35 | 35+ | ||
| No. of households | 200 | 300 | 300 | 200 | ||
| No. of households with a landline phone | 40 | 150 | 60 | 100 | ||
Let A denote Community A.
Let B denote Community B.

Trending now
This is a popular solution!

Step by step
Solved in 4 steps


