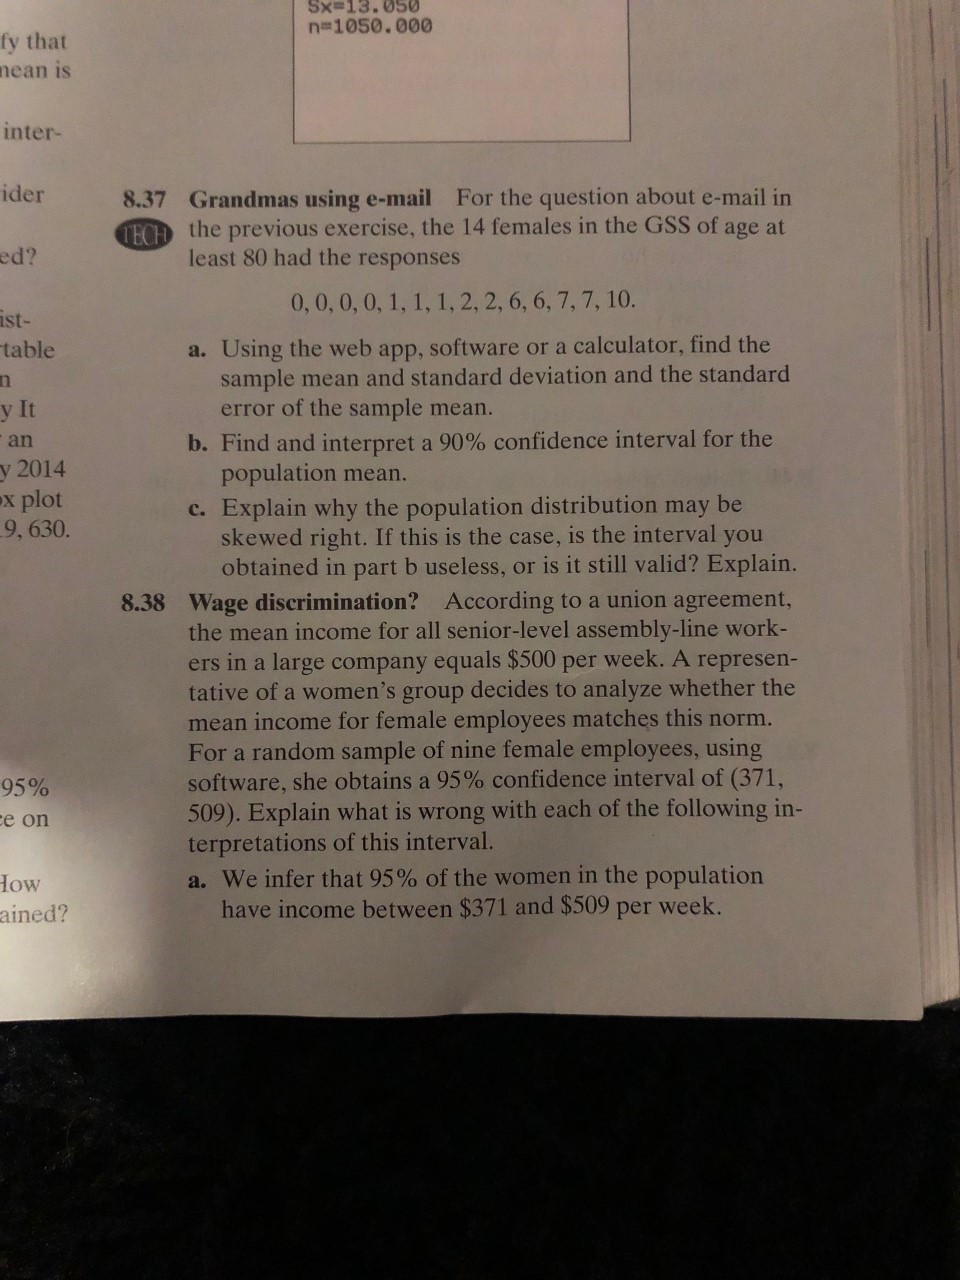
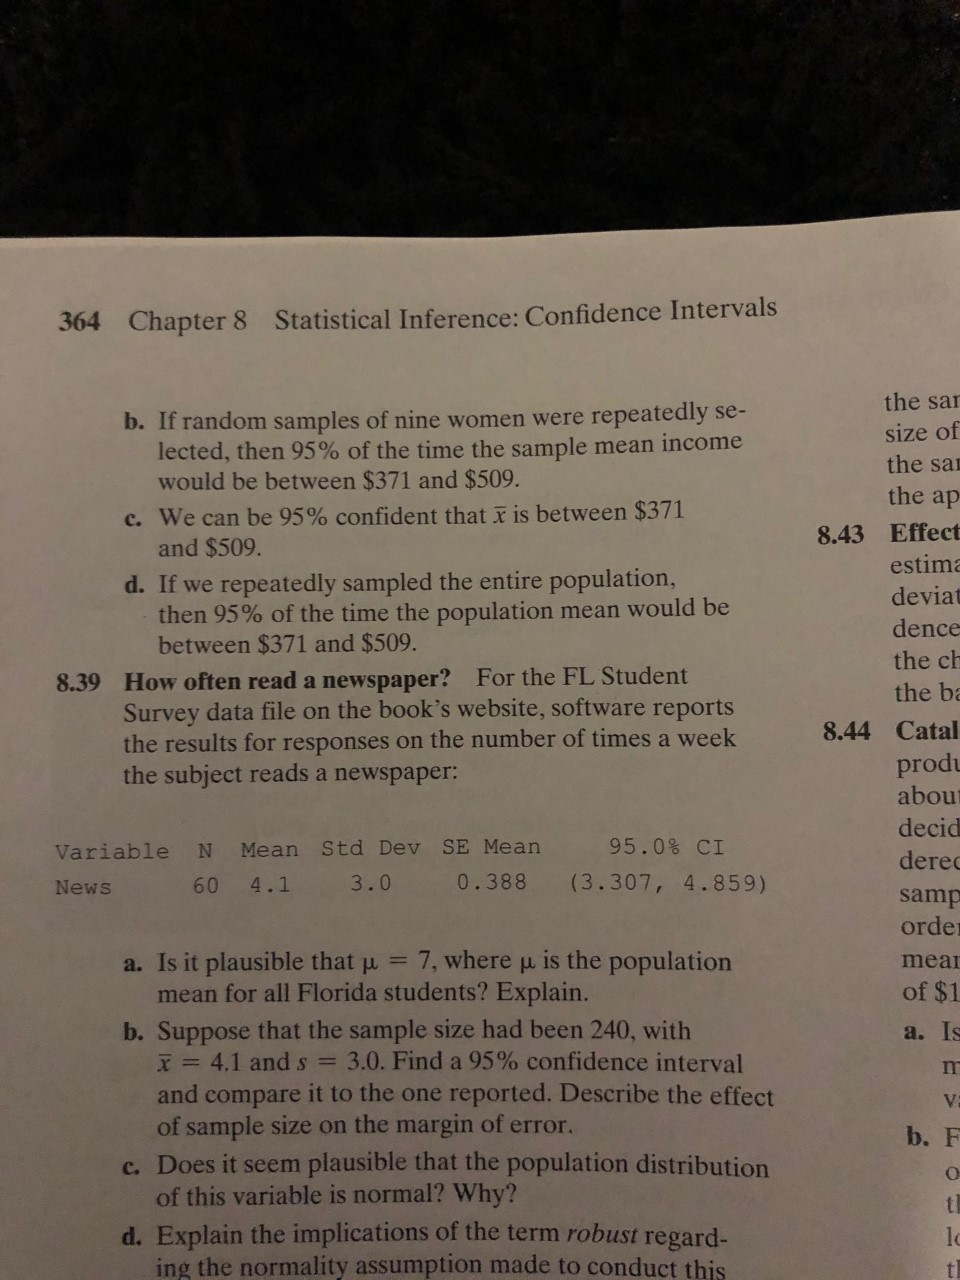
Sx=13.050 n-1050.000 fy that nean is inter- ider 8.37 Grandmas using e-mail For the question about e-mail in ECH the previous exercise, the 14 females in the GSS of age at least 80 had the responses ed? 0,0,0, 0, 1, 1, 1,2, 2, 6, 6, 7, 7, 10. ist- table a. Using the web app, software or a calculator, find the sample mean and standard deviation and the standard error of the sample mean. y It b. Find and interpret a 90% confidence interval for the population mean. c. Explain why the population distribution may be skewed right. If this is the case, is the interval you obtained in part b useless, or is it still valid? Explain. an у 2014 ex plot 9, 630. 8.38 Wage discrimination? According to a union agreement, the mean income for all senior-level assembly-line work- ers in a large company equals $500 per week. A represen- tative of a women's group decides to analyze whether the mean income for female employe es matches this norm. For a random sample of nine female employees, using software, she obtains a 95% confidence interval of (371, 509). Explain what is wrong with each of the following in- terpretations of this interval. a. We infer that 95 % of the women in the population have income between $371 and $509 per week. 95% ce on HOw ained? Statistical Inference: Confidence Intervals 364 Chapter 8 the sar b. If random samples of nine women were repeatedly se- lected, then 95% of the time the sample mean income would be between $371 and $509. size of the sa the ap c. We can be 95% confident that x is between $371 and $509. 8.43 Effect estim d. If we repeatedly sampled the entire population, then 95% of the time the population mean would be between $371 and $509. deviat dence the ch How often read a newspaper? For the FL Student Survey data file on the book's website, software reports the results for responses on the numberof times a week the subject reads a newspaper: 8.39 the ba 8.44 Catal produ abou decid 95.0% CI Mean Std Dev SE Mean Variable derec (3.307, 4.859) 3.0 0.388 4.1 60 News samp orde a. Is it plausible that p 7, where u is the population mean for all Florida students? Explain. mear of $1 b. Suppose that the sample size had been 240, with x=4.1 and s 3.0. Find a 95% confidence interval and compare it to the one reported. Describe the effect of sample size on the margin of error. c. Does it seem plausible that the population distribution of this variable is normal? Why? а. Is V b. F th d. Explain the implications of the term robust regard- ing the normality assumption made to conduct this lc tl


Correlation
Correlation defines a relationship between two independent variables. It tells the degree to which variables move in relation to each other. When two sets of data are related to each other, there is a correlation between them.
Linear Correlation
A correlation is used to determine the relationships between numerical and categorical variables. In other words, it is an indicator of how things are connected to one another. The correlation analysis is the study of how variables are related.
Regression Analysis
Regression analysis is a statistical method in which it estimates the relationship between a dependent variable and one or more independent variable. In simple terms dependent variable is called as outcome variable and independent variable is called as predictors. Regression analysis is one of the methods to find the trends in data. The independent variable used in Regression analysis is named Predictor variable. It offers data of an associated dependent variable regarding a particular outcome.
8.38 A,B,C


Trending now
This is a popular solution!

Step by step
Solved in 2 steps


