t is thought that basketball teams that make too many fouls in a game te co lose the game even if they otherwise play well. Let x be the number of ouls more than (i.e., over and above) the opposing team. Let y be the percentage of times the team with the larger number of fouls wins the game. 5
t is thought that basketball teams that make too many fouls in a game te co lose the game even if they otherwise play well. Let x be the number of ouls more than (i.e., over and above) the opposing team. Let y be the percentage of times the team with the larger number of fouls wins the game. 5

MATLAB: An Introduction with Applications
6th Edition
ISBN:9781119256830
Author:Amos Gilat
Publisher:Amos Gilat
Chapter1: Starting With Matlab
Section: Chapter Questions
Problem 1P

Related questions
Question
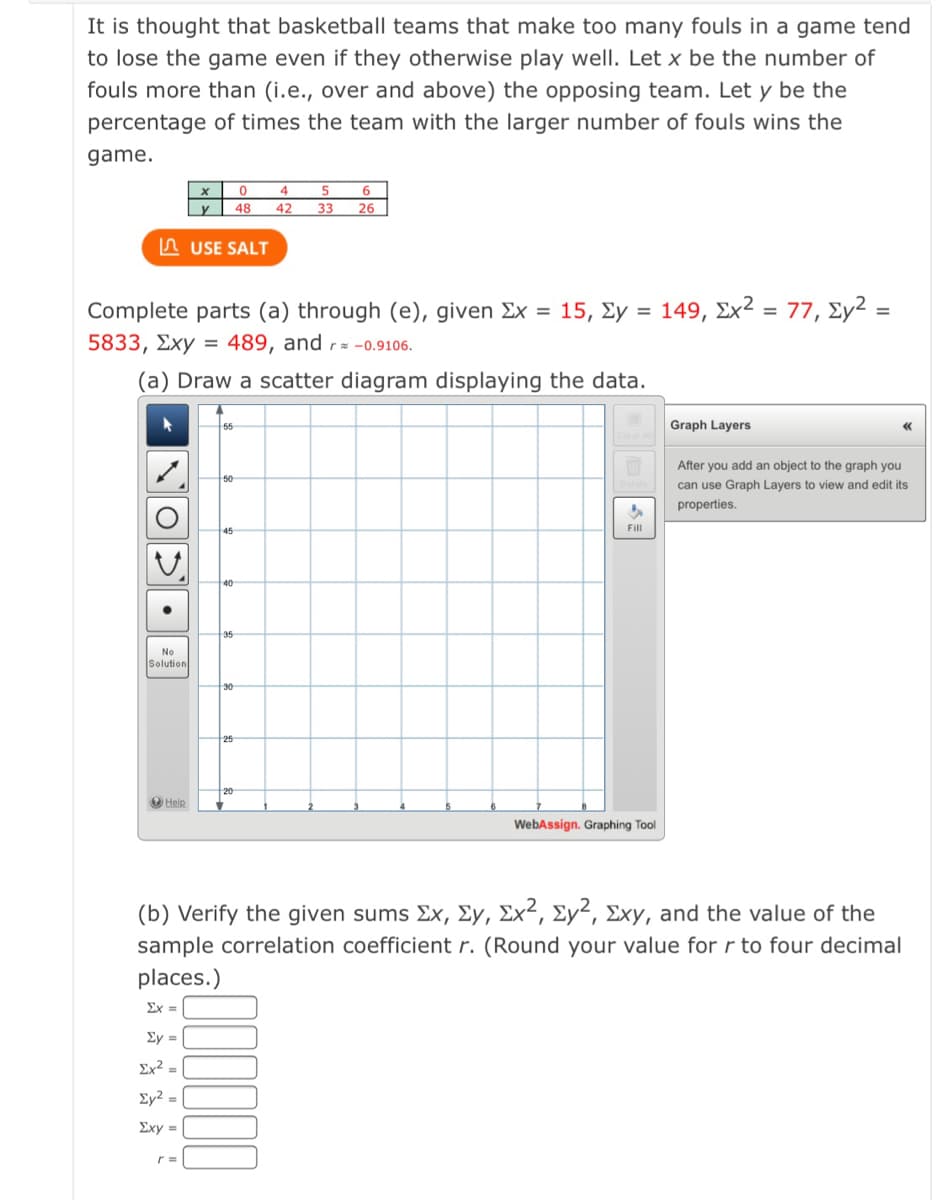
Transcribed Image Text:It is thought that basketball teams that make too many fouls in a game tend
to lose the game even if they otherwise play well. Let x be the number of
fouls more than (i.e., over and above) the opposing team. Let y be the
percentage of times the team with the larger number of fouls wins the
game.
4
y
48
42
33
26
A USE SALT
Complete parts (a) through (e), given Ex = 15, Ey = 149, Ex² = 77, Ey² =
5833, Exy = 489, and r= -0.9106.
(a) Draw a scatter diagram displaying the data.
55
Graph Layers
After you add an object to the graph you
50
can use Graph Layers to view and edit its
properties.
Fill
45
40
35
No
Solution
30
25
20
O Help
WebAssign. Graphing Tool
( b) Verify the given sums Σχ, Σγ, Σχ, Σy, Σχy, and the value of the
sample correlation coefficient r. (Round your value forr to four decimal
places.)
Σχ
Ey =
Ex? =
Ey? =
Exy =
r =
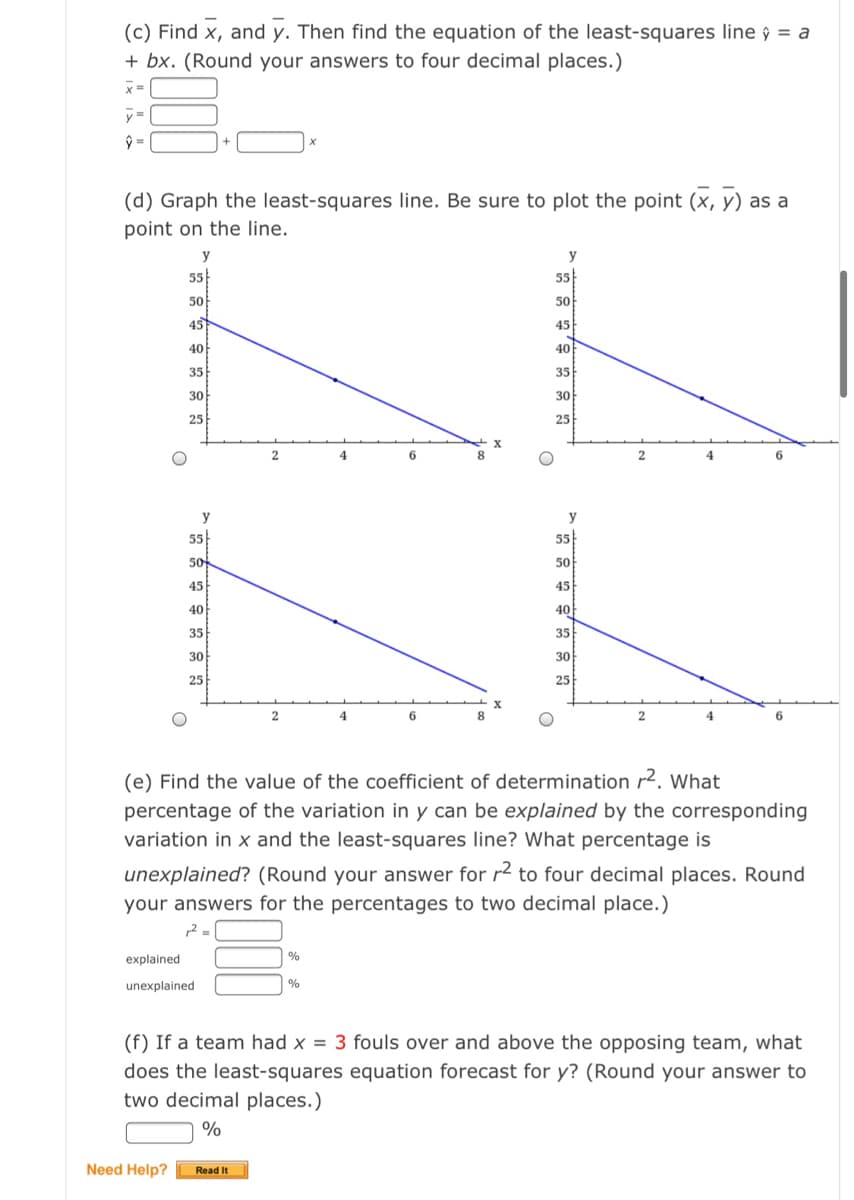
Transcribed Image Text:(c) Find x, and y. Then find the equation of the least-squares line ŷ = a
+ bx. (Round your answers to four decimal places.)
x =
ŷ =
(d) Graph the least-squares line. Be sure to plot the point (x, y) as a
point on the line.
y
55
55
50
50
45
45
40
40
35
35
30
30
25
25
4
6.
2.
4
6.
y
55
55
50
50
45
45
40
40
35
35
30
30
25
25
8.
2
6.
(e) Find the value of the coefficient of determination r². What
percentage of the variation in y can be explained by the corresponding
variation in x and the least-squares line? What percentage is
unexplained? (Round your answer for r2
four decimal places. Round
your answers for the percentages to two decimal place.)
explained
unexplained
(f) If a team had x = 3 fouls over and above the opposing team, what
does the least-squares equation forecast for y? (Round your answer to
two decimal places.)
%
Need Help?
Read It
Expert Solution
Working
Note: “Since you have posted a question with multiple sub-parts, we will solve first three subparts for you. To get remaining sub-part solved please repost the complete question and
mention the sub-parts to be solved.
| x | y | (x-xbar) | (x-xbar)^2 | (y-ybar) | (y-ybar)^2 | (x-xbar)*(y-ybar) |
| 0 | 48 | -3.75 | 14.0625 | 10.75 | 115.5625 | -40.3125 |
| 4 | 42 | 0.25 | 0.0625 | 4.75 | 22.5625 | 1.1875 |
| 5 | 33 | 1.25 | 1.5625 | -4.25 | 18.0625 | -5.3125 |
| 6 | 26 | 2.25 | 5.0625 | -11.25 | 126.5625 | -25.3125 |

Trending now
This is a popular solution!

Step by step
Solved in 4 steps with 8 images

Knowledge Booster


Learn more about
Need a deep-dive on the concept behind this application? Look no further. Learn more about this topic, statistics and related others by exploring similar questions and additional content below.Recommended textbooks for you
MATLAB: An Introduction with Applications
Statistics
ISBN:
9781119256830
Author:
Amos Gilat
Publisher:
John Wiley & Sons Inc

Probability and Statistics for Engineering and th…
Statistics
ISBN:
9781305251809
Author:
Jay L. Devore
Publisher:
Cengage Learning

Statistics for The Behavioral Sciences (MindTap C…
Statistics
ISBN:
9781305504912
Author:
Frederick J Gravetter, Larry B. Wallnau
Publisher:
Cengage Learning
MATLAB: An Introduction with Applications
Statistics
ISBN:
9781119256830
Author:
Amos Gilat
Publisher:
John Wiley & Sons Inc
Probability and Statistics for Engineering and th…
Statistics
ISBN:
9781305251809
Author:
Jay L. Devore
Publisher:
Cengage Learning
Statistics for The Behavioral Sciences (MindTap C…
Statistics
ISBN:
9781305504912
Author:
Frederick J Gravetter, Larry B. Wallnau
Publisher:
Cengage Learning

Elementary Statistics: Picturing the World (7th E…
Statistics
ISBN:
9780134683416
Author:
Ron Larson, Betsy Farber
Publisher:
PEARSON

The Basic Practice of Statistics
Statistics
ISBN:
9781319042578
Author:
David S. Moore, William I. Notz, Michael A. Fligner
Publisher:
W. H. Freeman

Introduction to the Practice of Statistics
Statistics
ISBN:
9781319013387
Author:
David S. Moore, George P. McCabe, Bruce A. Craig
Publisher:
W. H. Freeman