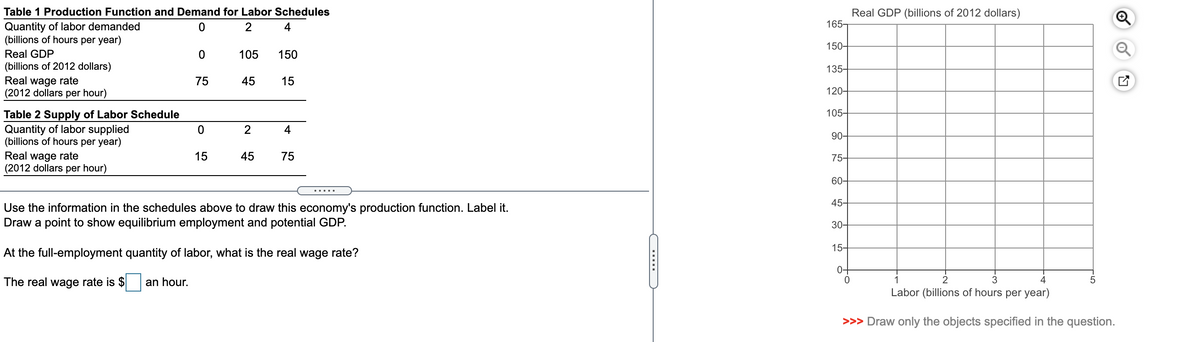
Table 1 Production Function and Demand for Labor Schedules Real GDP (billions of 2012 dollars) 165- Quantity of labor demanded (billions of hours per year) 4 150- Real GDP (billions of 2012 dollars) Real wage rate (2012 dollars per hour) 105 150 135- 75 45 15 120- 105- Table 2 Supply of Labor Schedule Quantity of labor supplied (billions of hours per year) Real wage rate (2012 dollars per hour) 2 4 90- 15 45 75 75- 60- 45- Use the information in the schedules above to draw this economy's production function. Label it. Draw a point to show equilibrium employment and potential GDP. 30- 15- At the full-employment quantity of labor, what is the real wage rate? 0- The real wage rate is $ an hour. Labor (billions of hours per year)
Table 1 Production Function and Demand for Labor Schedules Real GDP (billions of 2012 dollars) 165- Quantity of labor demanded (billions of hours per year) 4 150- Real GDP (billions of 2012 dollars) Real wage rate (2012 dollars per hour) 105 150 135- 75 45 15 120- 105- Table 2 Supply of Labor Schedule Quantity of labor supplied (billions of hours per year) Real wage rate (2012 dollars per hour) 2 4 90- 15 45 75 75- 60- 45- Use the information in the schedules above to draw this economy's production function. Label it. Draw a point to show equilibrium employment and potential GDP. 30- 15- At the full-employment quantity of labor, what is the real wage rate? 0- The real wage rate is $ an hour. Labor (billions of hours per year)

Chapter3: Economic Decision Makers
Section: Chapter Questions
Problem 1.2P

Related questions
Question
Transcribed Image Text:Table 1 Production Function and Demand for Labor Schedules
Real GDP (billions of 2012 dollars)
165-
Quantity of labor demanded
(billions of hours per year)
4
150-
Real GDP
105
150
(billions of 2012 dollars)
135-
Real wage rate
(2012 dollars per hour)
75
45
15
120-
105-
Table 2 Supply of Labor Schedule
Quantity of labor supplied
(billions of hours per year)
Real wage rate
(2012 dollars per hour)
4
90-
15
45
75
75-
60-
45-
Use the information in the schedules above to draw this economy's production function. Label it.
Draw a point to show equilibrium employment and potential GDP.
30-
15-
At the full-employment quantity of labor, what is the real wage rate?
0-
The real wage rate is $ an hour.
1
2
3
4
Labor (billions of hours per year)
>>> Draw only the objects specified in the question.
Expert Solution
This question has been solved!
Explore an expertly crafted, step-by-step solution for a thorough understanding of key concepts.

This is a popular solution!

Trending now
This is a popular solution!

Step by step
Solved in 2 steps with 1 images

Recommended textbooks for you


Principles of Microeconomics
Economics
ISBN:
9781305156050
Author:
N. Gregory Mankiw
Publisher:
Cengage Learning
Principles of Microeconomics
Economics
ISBN:
9781305156050
Author:
N. Gregory Mankiw
Publisher:
Cengage Learning