Table 1 Sample Mean X = 5 ỹ = 4 z = 5 Sample Variance Sx2 = 1 Sy2 = 3 S22 = 13 Sample Standard Deviation Sx = 1 Sy = 1.732 Sz = 3.606 Table 2 shows the observations for x and y and their corresponding deviations from the sample means. Table 2 Xị -i yi - ỹ Xị yi 1 1.
Table 1 Sample Mean X = 5 ỹ = 4 z = 5 Sample Variance Sx2 = 1 Sy2 = 3 S22 = 13 Sample Standard Deviation Sx = 1 Sy = 1.732 Sz = 3.606 Table 2 shows the observations for x and y and their corresponding deviations from the sample means. Table 2 Xị -i yi - ỹ Xị yi 1 1.

Glencoe Algebra 1, Student Edition, 9780079039897, 0079039898, 2018
18th Edition
ISBN:9780079039897
Author:Carter
Publisher:Carter
Chapter4: Equations Of Linear Functions
Section4.5: Correlation And Causation
Problem 24PFA

Related questions

Question
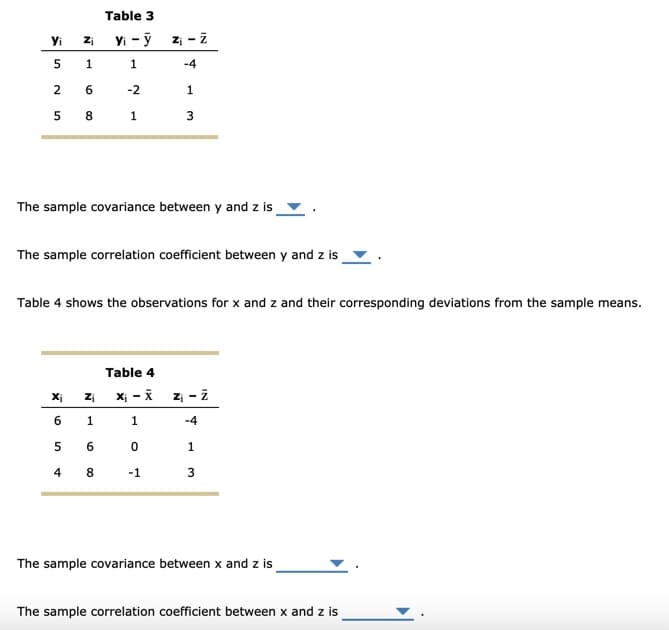
Transcribed Image Text:Table 3
Yi
Yi - ỹ
Zi - z
Zi
1.
-4
-2
1
3
The sample covariance between y and z is
The sample correlation coefficient between y and z is
Table 4 shows the observations for x and z and their corresponding deviations from the sample means.
Table 4
Xị
z; - i
Zi
6.
1
-4
4
8
-1
The sample covariance between x and z is
The sample correlation coefficient between x and z is
1.
3.
1,
6.
2.
5.
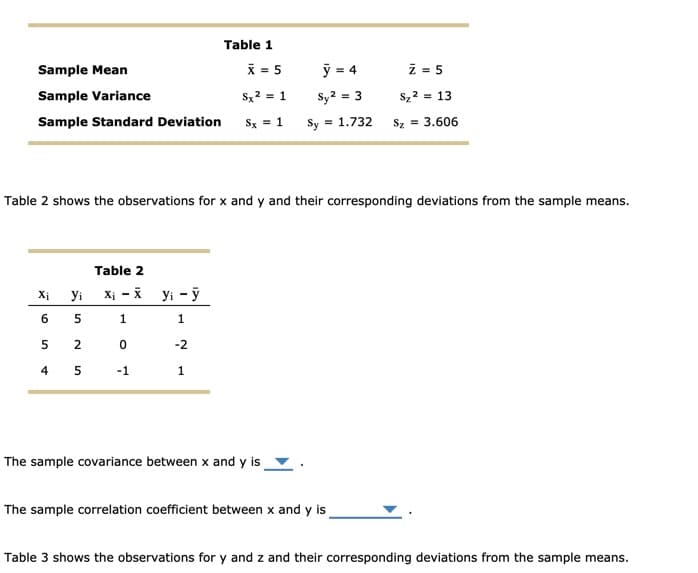
Transcribed Image Text:Table 1
Sample Mean
X = 5
ỹ = 4
z = 5
Sample Variance
Sx 2 = 1
Sy2 = 3
s2 2 = 13
Sample Standard Deviation
Sx = 1
Sy
= 1.732
Sz = 3.606
Table 2 shows the observations for x and y and their corresponding deviations from the sample means.
Table 2
Xị -i yi - ỹ
Xị
yi
1.
5
-2
4 5
-1
1
The sample covariance between x and y is
The sample correlation coefficient between x and y is
Table 3 shows the observations for y and z and their corresponding deviations from the sample means.
2.
Expert Solution
Step 1
Covariance is a measure which we use in statistics to find the variability in two variables which we use. If two variable varies in the same direction then it is positive covariance. If the variables vary in the opposite direction, then it is negative covariance.

Trending now
This is a popular solution!

Step by step
Solved in 3 steps

Knowledge Booster


Learn more about
Need a deep-dive on the concept behind this application? Look no further. Learn more about this topic, statistics and related others by exploring similar questions and additional content below.Recommended textbooks for you
Glencoe Algebra 1, Student Edition, 9780079039897…
Algebra
ISBN:
9780079039897
Author:
Carter
Publisher:
McGraw Hill
Glencoe Algebra 1, Student Edition, 9780079039897…
Algebra
ISBN:
9780079039897
Author:
Carter
Publisher:
McGraw Hill