of various intensities and frequencies. Of these 45 listeners, 15 had normal hearing, 15 use at low frequencies (but didn't use hearing aids). Here is a summary of the data obtained fo sone values corresponding to this tone). Sample size Sample Sample Groups mean variance Normal hearing 15 2.41 0.1 Hearing aid 15 2.01 0.4 Some hearing 15 1.98 0.1 loss Send data to calculator Are there differences in the mean sone values for this tone for the populations of listeners aids, and listeners with low-frequency hearing loss? We can perform a one-way, independe question. Such a test uses the following statistic. Variation between the samples F= Variation vithin the samples For the data summarized above, F 3.81. (a) Give the numerator degrees of freedom of this F statistic. (b) Give the denominator degrees of freedom of this F statistic. (c) Based on these data, and using the 0.01 level of significance, should you cònclude that there are differences in the mean sone values for this tone Yes O No among the three groups?
of various intensities and frequencies. Of these 45 listeners, 15 had normal hearing, 15 use at low frequencies (but didn't use hearing aids). Here is a summary of the data obtained fo sone values corresponding to this tone). Sample size Sample Sample Groups mean variance Normal hearing 15 2.41 0.1 Hearing aid 15 2.01 0.4 Some hearing 15 1.98 0.1 loss Send data to calculator Are there differences in the mean sone values for this tone for the populations of listeners aids, and listeners with low-frequency hearing loss? We can perform a one-way, independe question. Such a test uses the following statistic. Variation between the samples F= Variation vithin the samples For the data summarized above, F 3.81. (a) Give the numerator degrees of freedom of this F statistic. (b) Give the denominator degrees of freedom of this F statistic. (c) Based on these data, and using the 0.01 level of significance, should you cònclude that there are differences in the mean sone values for this tone Yes O No among the three groups?

Mathematics For Machine Technology
8th Edition
ISBN:9781337798310
Author:Peterson, John.
Publisher:Peterson, John.
Chapter38: Achievement Review—section Three
Section: Chapter Questions
Problem 6AR

Related questions

Question
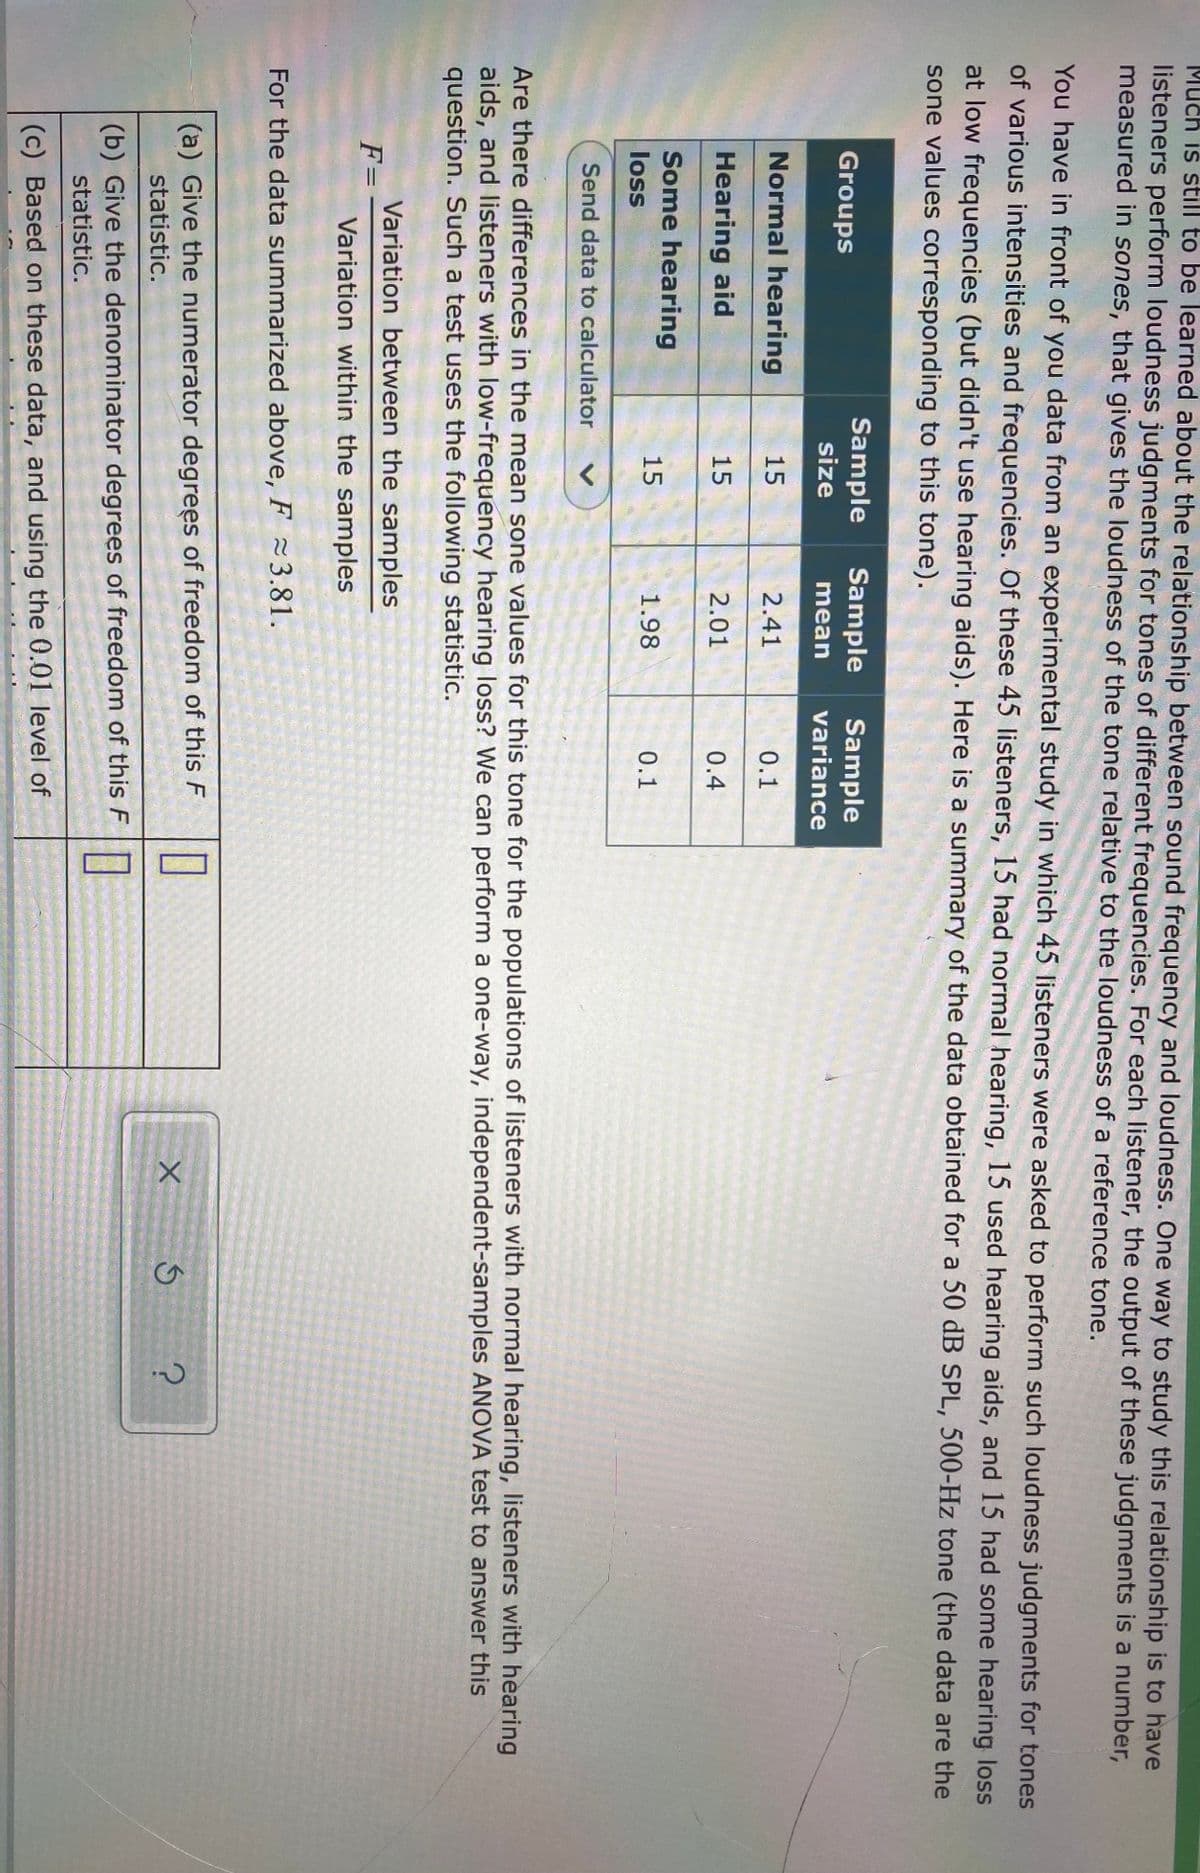
Transcribed Image Text:Much is still to be learned about the relationship between sound frequency and loudness. One way to study this relationship is to have
listeners perform loudness judgments for tones of different frequencies. For each listener, the output of these judgments is a number,
measured in sones, that gives the loudness of the tone relative to the loudness of a reference tone.
You have in front of you data from an experimental study in which 45 listeners were asked to perform such loudness judgments for tones
of various intensities and frequencies. Of these 45 listeners, 15 had normal hearing, 15 used hearing aids, and 15 had some hearing loss
at low frequencies (but didn't use hearing aids). Here is a summary of the data obtained for a 50 dB SPL, 500-Hz tone (the data are the
sone values corresponding to this tone).
Sample
size
Sample
Sample
variance
Groups
mean
Normal hearing
15
2.41
0.1
Hearing aid
15
2.01
0.4
Some hearing
15
1.98
0.1
loss
Send data to calculator
Are there differences in the mean sone values for this tone for the populations of listeners with normal hearing, listeners with hearing
aids, and listeners with low-frequency hearing loss? We can perform a one-way, independent-samples ANOVA test to answer this
question. Such a test uses the following statistic.
Variation between the samples
F=
Variation within the samples
For the data summarized above, F 3.81.
(a) Give the numerator degrees of freedom of this F
statistic.
(b) Give the denominator degrees of freedom of this F
statistic.
(c) Based on these data, and using the 0.01 level of
Transcribed Image Text:15
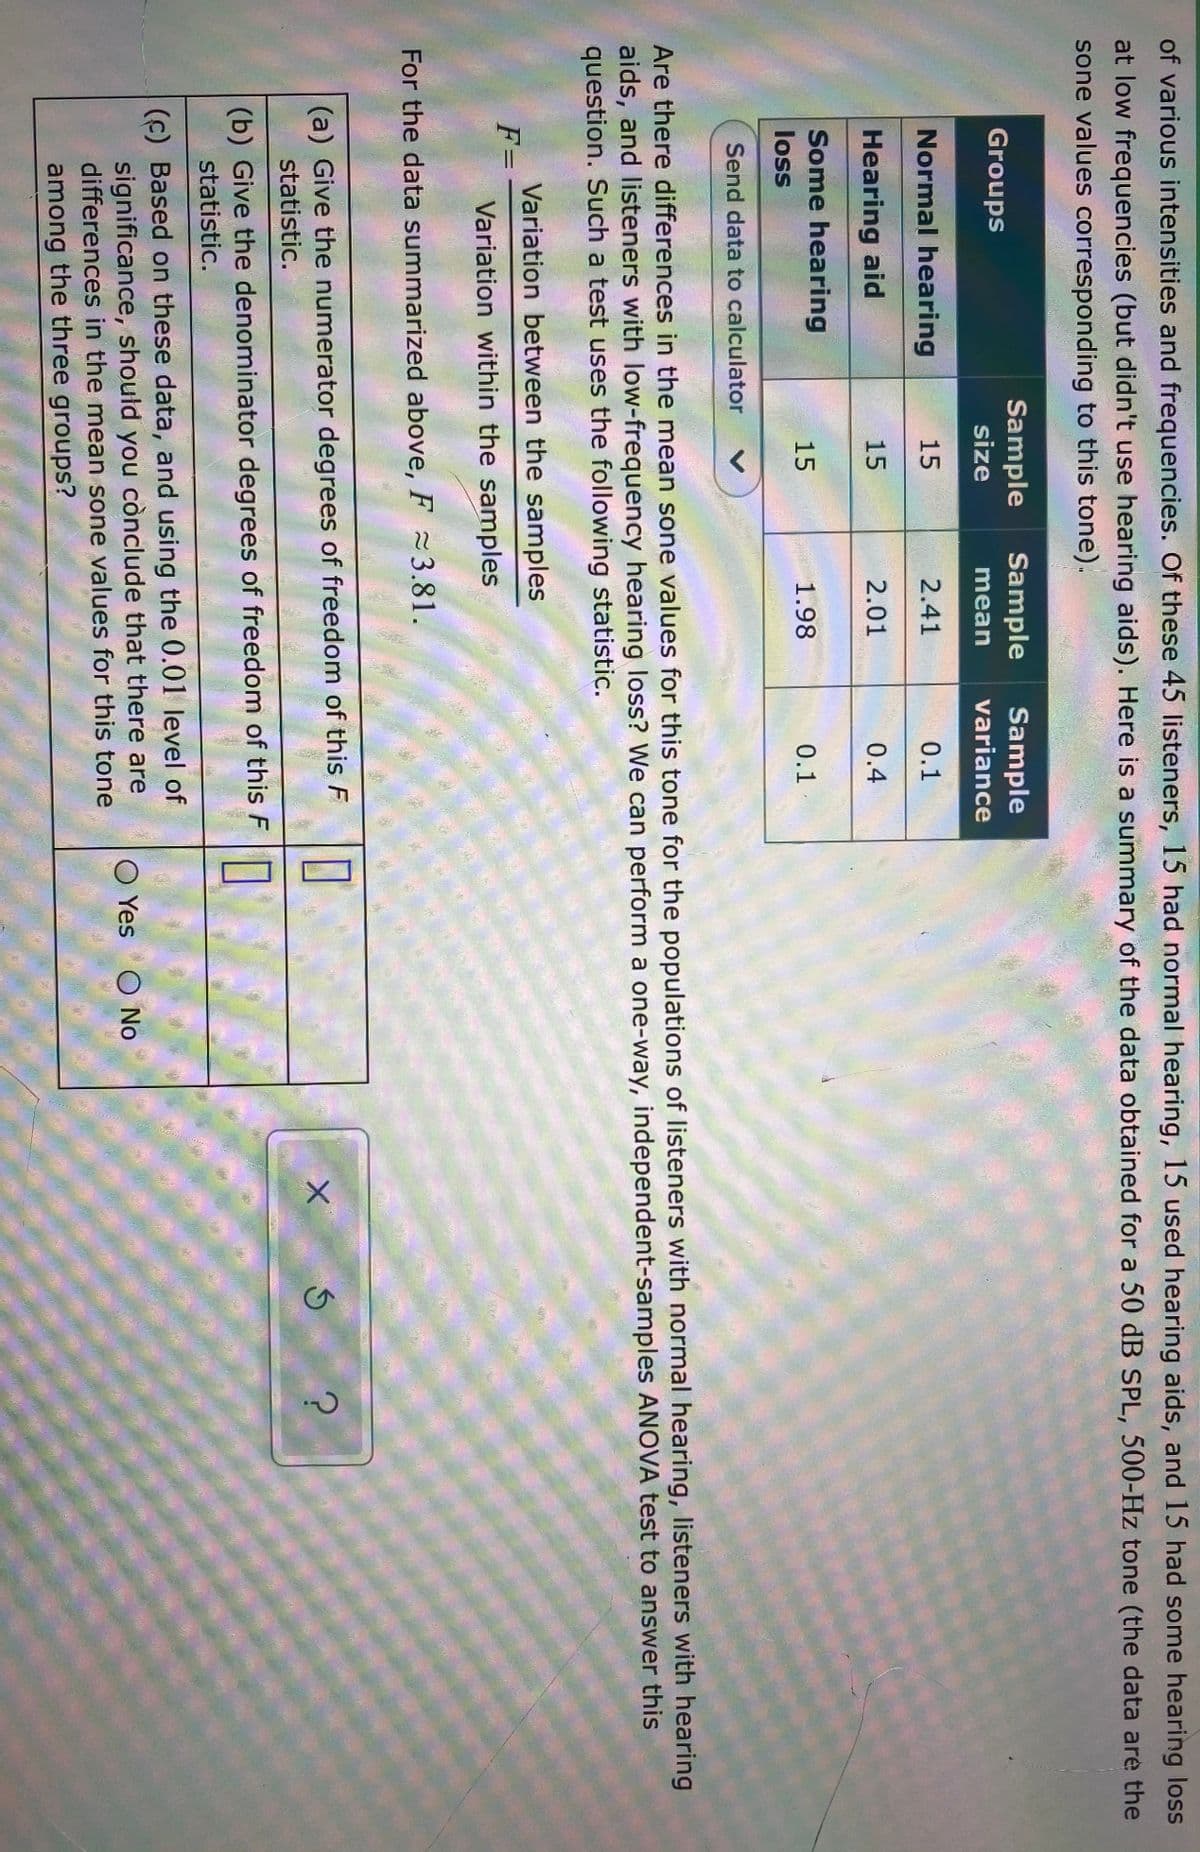
of various intensities and frequencies. Of these 45 listeners, 15 had normal hearing, 15 used hearing aids, and 15 had some hearing loss
at low frequencies (but didn't use hearing aids). Here is a summary of the data obtained for a 50 dB SPL, 500-Hz tone (the data are the
sone values corresponding to this tone).
Sample
Sample
Sample
variance
Groups
size
mean
Normal hearing
15
2.41
0.1
Hearing aid
15
2.01
0.4
Some hearing
1.98
0.1-
loss
Send data to calculator
Are there differences in the mean sone values for this tone for the populations of listeners with normal hearing, listeners with hearing
aids, and listeners with low-frequency hearing loss? We can perform a one-way, independent-samples ANOVA test to answer this
question. Such a test uses the following statistic.
Variation between the samples
F=
Variation within the samples
For the data summarized above, F 3.81.
(a) Give the numerator degrees of freedom of this F
statistic.
(b) Give the denominator degrees of freedom of this F
statistic.
(c) Based on these data, and using the 0.01 level of
significance, should you cònclude that there are
differences in the mean sone values for this tone
O Yes O No
among the three groups?
Expert Solution
This question has been solved!
Explore an expertly crafted, step-by-step solution for a thorough understanding of key concepts.

Step by step
Solved in 5 steps

Knowledge Booster


Learn more about
Need a deep-dive on the concept behind this application? Look no further. Learn more about this topic, statistics and related others by exploring similar questions and additional content below.Recommended textbooks for you
Mathematics For Machine Technology
Advanced Math
ISBN:
9781337798310
Author:
Peterson, John.
Publisher:
Cengage Learning,


Glencoe Algebra 1, Student Edition, 9780079039897…
Algebra
ISBN:
9780079039897
Author:
Carter
Publisher:
McGraw Hill
Mathematics For Machine Technology
Advanced Math
ISBN:
9781337798310
Author:
Peterson, John.
Publisher:
Cengage Learning,
Glencoe Algebra 1, Student Edition, 9780079039897…
Algebra
ISBN:
9780079039897
Author:
Carter
Publisher:
McGraw Hill

Algebra for College Students
Algebra
ISBN:
9781285195780
Author:
Jerome E. Kaufmann, Karen L. Schwitters
Publisher:
Cengage Learning

Holt Mcdougal Larson Pre-algebra: Student Edition…
Algebra
ISBN:
9780547587776
Author:
HOLT MCDOUGAL
Publisher:
HOLT MCDOUGAL