Table 1 Total displacement (cm) Time (interval) Average velocity (cm/interval) Displacement (cm) Cm CM 4.2 2 2.2 Cm 2.2 CM 3 2.2 Cm 2.2 cm 2.6 2.2 Cm 4 2.2 CM TT 2.4 Cm 5 2.4 Cm (3.4 2.4 cm 6 2-4 CM 15.9 2.5cm 7 CM 2.5 2.4 cm 18.3 8 2.4 cm 2.6 cm 20.9 9 2.6 CM 23.5 2.6cm Cm 10 2.6 Analysis 1. On a sheet of graph paper, plot the velocities (vertical axis) versus the corresponding time interva Is (horizontal axis). Be sure that each graph you plot in this experiment has a title and that all axes are properly labeled. 2. Write an explanation for what the graph shows. Point out any location on the graph that shows constant velocity or changing velocity. Calculate the vehicle's average velocity for the entire trip. How does it compare to the velocities during each interval? Using a colored pencil or a pen, draw a line on your graph indicating this average velocity. Answer Question 2 nideing
Table 1 Total displacement (cm) Time (interval) Average velocity (cm/interval) Displacement (cm) Cm CM 4.2 2 2.2 Cm 2.2 CM 3 2.2 Cm 2.2 cm 2.6 2.2 Cm 4 2.2 CM TT 2.4 Cm 5 2.4 Cm (3.4 2.4 cm 6 2-4 CM 15.9 2.5cm 7 CM 2.5 2.4 cm 18.3 8 2.4 cm 2.6 cm 20.9 9 2.6 CM 23.5 2.6cm Cm 10 2.6 Analysis 1. On a sheet of graph paper, plot the velocities (vertical axis) versus the corresponding time interva Is (horizontal axis). Be sure that each graph you plot in this experiment has a title and that all axes are properly labeled. 2. Write an explanation for what the graph shows. Point out any location on the graph that shows constant velocity or changing velocity. Calculate the vehicle's average velocity for the entire trip. How does it compare to the velocities during each interval? Using a colored pencil or a pen, draw a line on your graph indicating this average velocity. Answer Question 2 nideing

College Physics
1st Edition
ISBN:9781938168000
Author:Paul Peter Urone, Roger Hinrichs
Publisher:Paul Peter Urone, Roger Hinrichs
Chapter3: Two-dimensional Kinematics
Section: Chapter Questions
Problem 63PE: The great astronomer Edwin Hubble discovered that all distant galaxies are receding from our Milky...

Related questions
Question
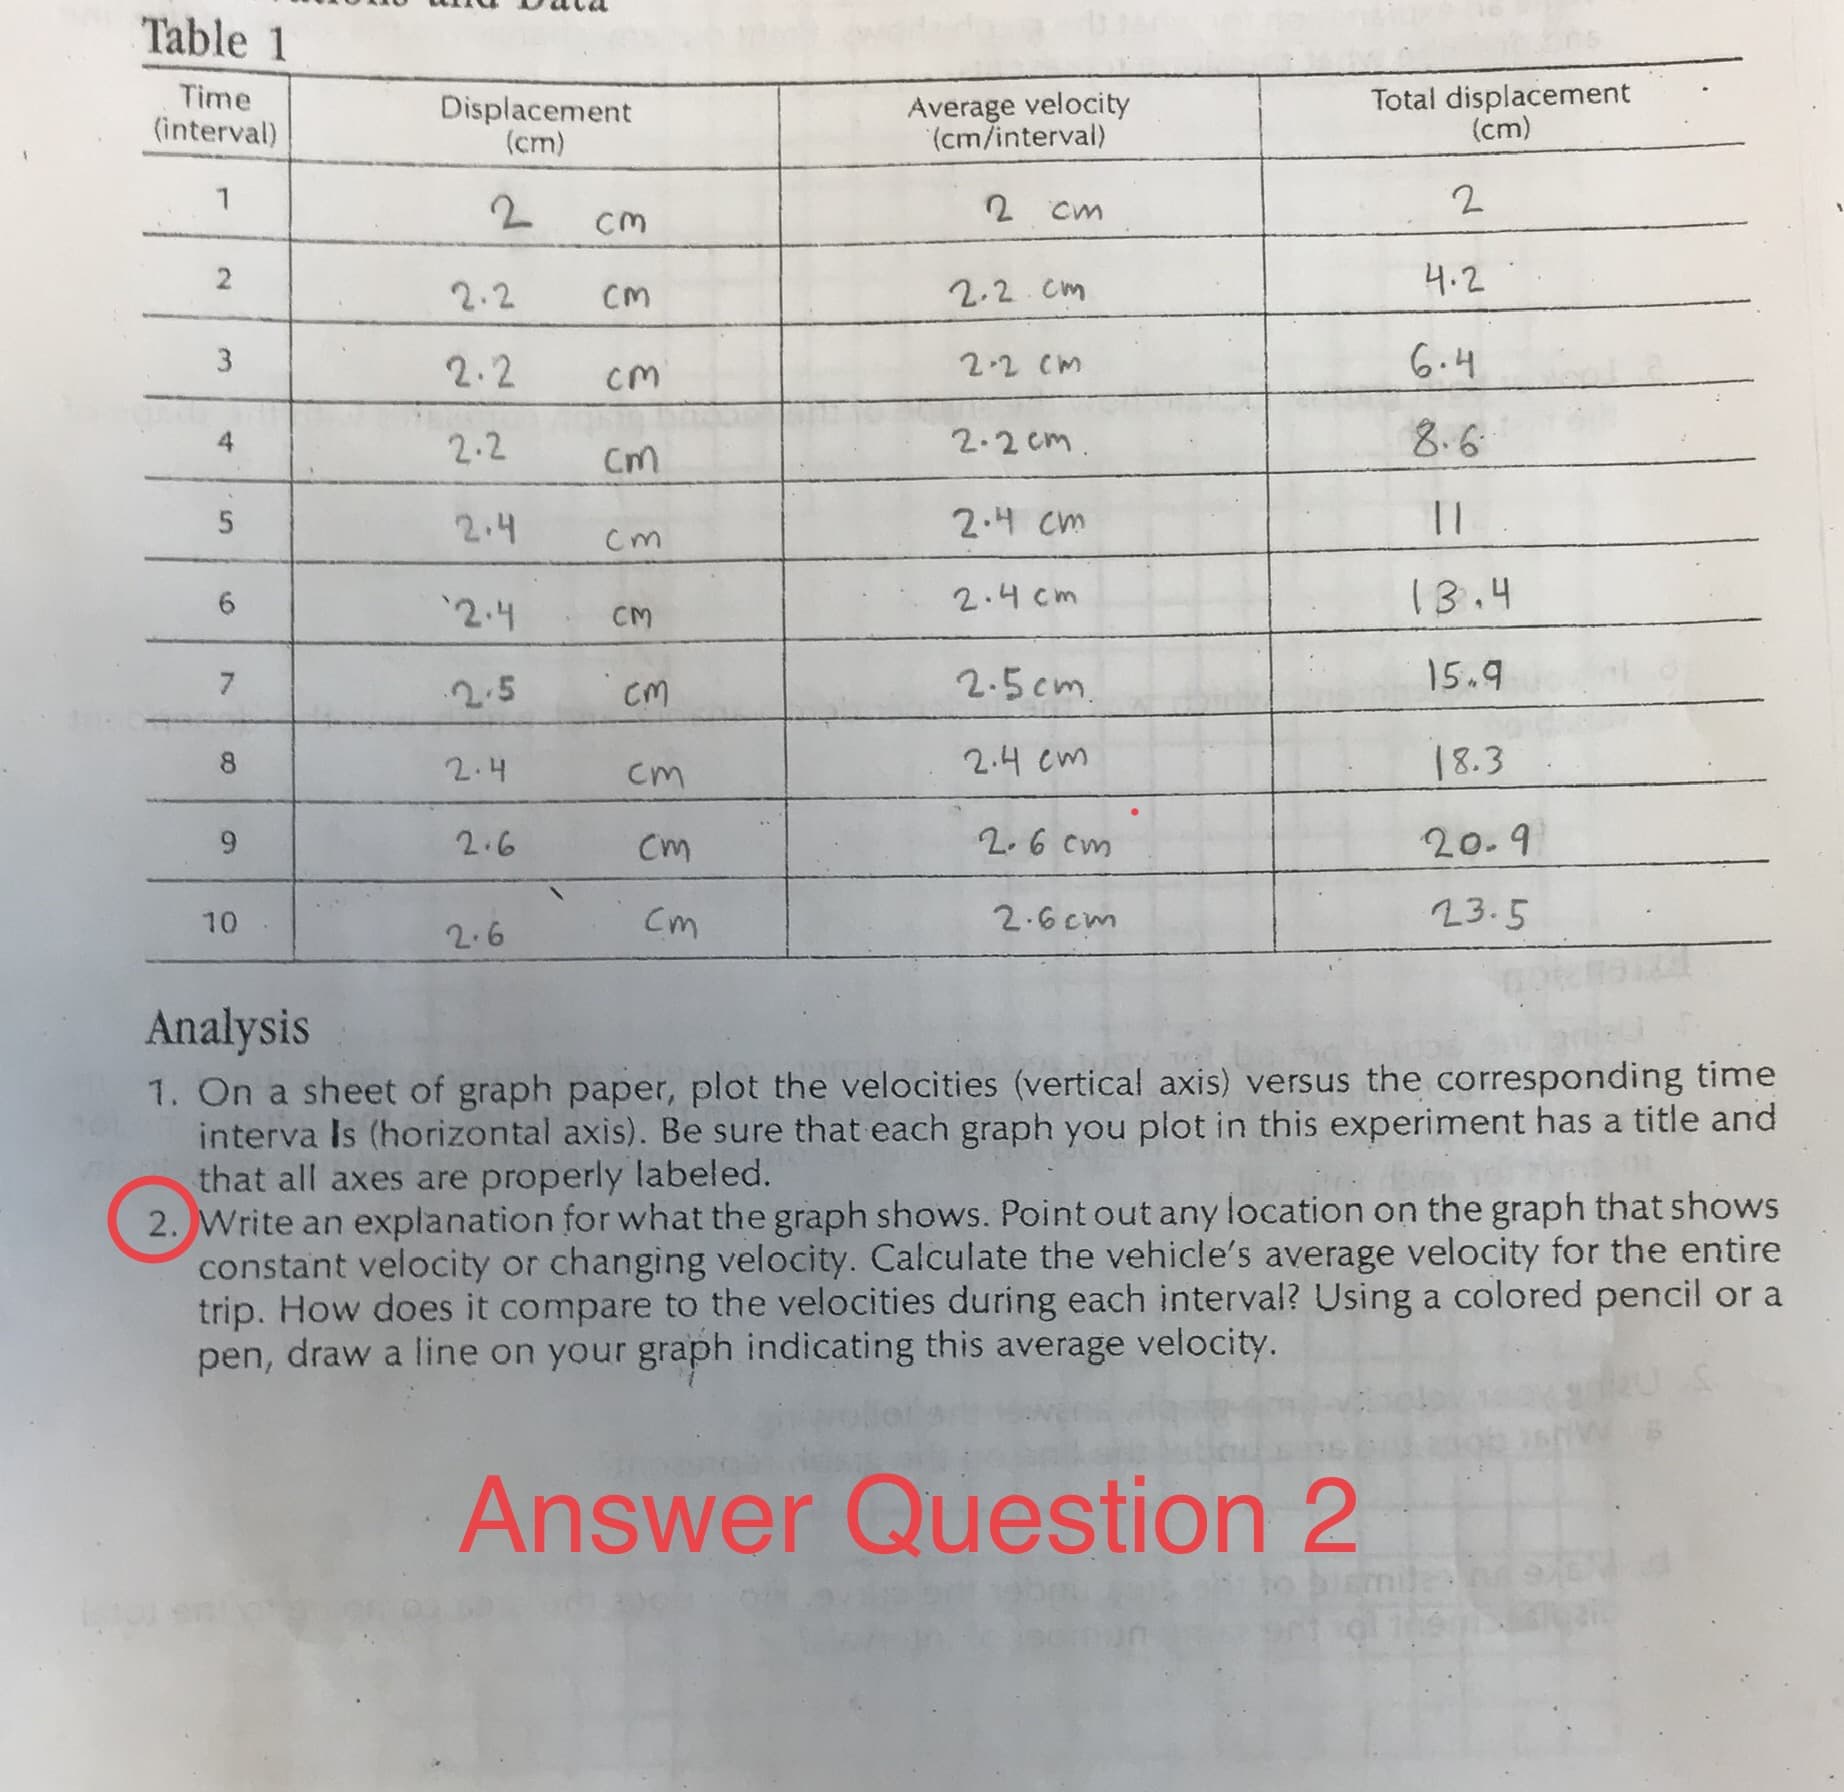
Transcribed Image Text:Table 1
Total displacement
(cm)
Time
(interval)
Average velocity
(cm/interval)
Displacement
(cm)
Cm
CM
4.2
2
2.2 Cm
2.2
CM
3
2.2 Cm
2.2
cm
2.6
2.2 Cm
4
2.2
CM
TT
2.4 Cm
5
2.4
Cm
(3.4
2.4 cm
6
2-4
CM
15.9
2.5cm
7
CM
2.5
2.4 cm
18.3
8
2.4
cm
2.6 cm
20.9
9
2.6
CM
23.5
2.6cm
Cm
10
2.6
Analysis
1. On a sheet of graph paper, plot the velocities (vertical axis) versus the corresponding time
interva Is (horizontal axis). Be sure that each graph you plot in this experiment has a title and
that all axes are properly labeled.
2. Write an explanation for what the graph shows. Point out any location on the graph that shows
constant velocity or changing velocity. Calculate the vehicle's average velocity for the entire
trip. How does it compare to the velocities during each interval? Using a colored pencil or a
pen, draw a line on your graph indicating this average velocity.
Answer Question 2
nideing
Expert Solution
This question has been solved!
Explore an expertly crafted, step-by-step solution for a thorough understanding of key concepts.

This is a popular solution!

Trending now
This is a popular solution!

Step by step
Solved in 2 steps with 2 images

Recommended textbooks for you
College Physics
Physics
ISBN:
9781938168000
Author:
Paul Peter Urone, Roger Hinrichs
Publisher:
OpenStax College

College Physics
Physics
ISBN:
9781305952300
Author:
Raymond A. Serway, Chris Vuille
Publisher:
Cengage Learning

Physics for Scientists and Engineers
Physics
ISBN:
9781337553278
Author:
Raymond A. Serway, John W. Jewett
Publisher:
Cengage Learning
College Physics
Physics
ISBN:
9781938168000
Author:
Paul Peter Urone, Roger Hinrichs
Publisher:
OpenStax College
College Physics
Physics
ISBN:
9781305952300
Author:
Raymond A. Serway, Chris Vuille
Publisher:
Cengage Learning
Physics for Scientists and Engineers
Physics
ISBN:
9781337553278
Author:
Raymond A. Serway, John W. Jewett
Publisher:
Cengage Learning

Physics for Scientists and Engineers with Modern …
Physics
ISBN:
9781337553292
Author:
Raymond A. Serway, John W. Jewett
Publisher:
Cengage Learning

An Introduction to Physical Science
Physics
ISBN:
9781305079137
Author:
James Shipman, Jerry D. Wilson, Charles A. Higgins, Omar Torres
Publisher:
Cengage Learning