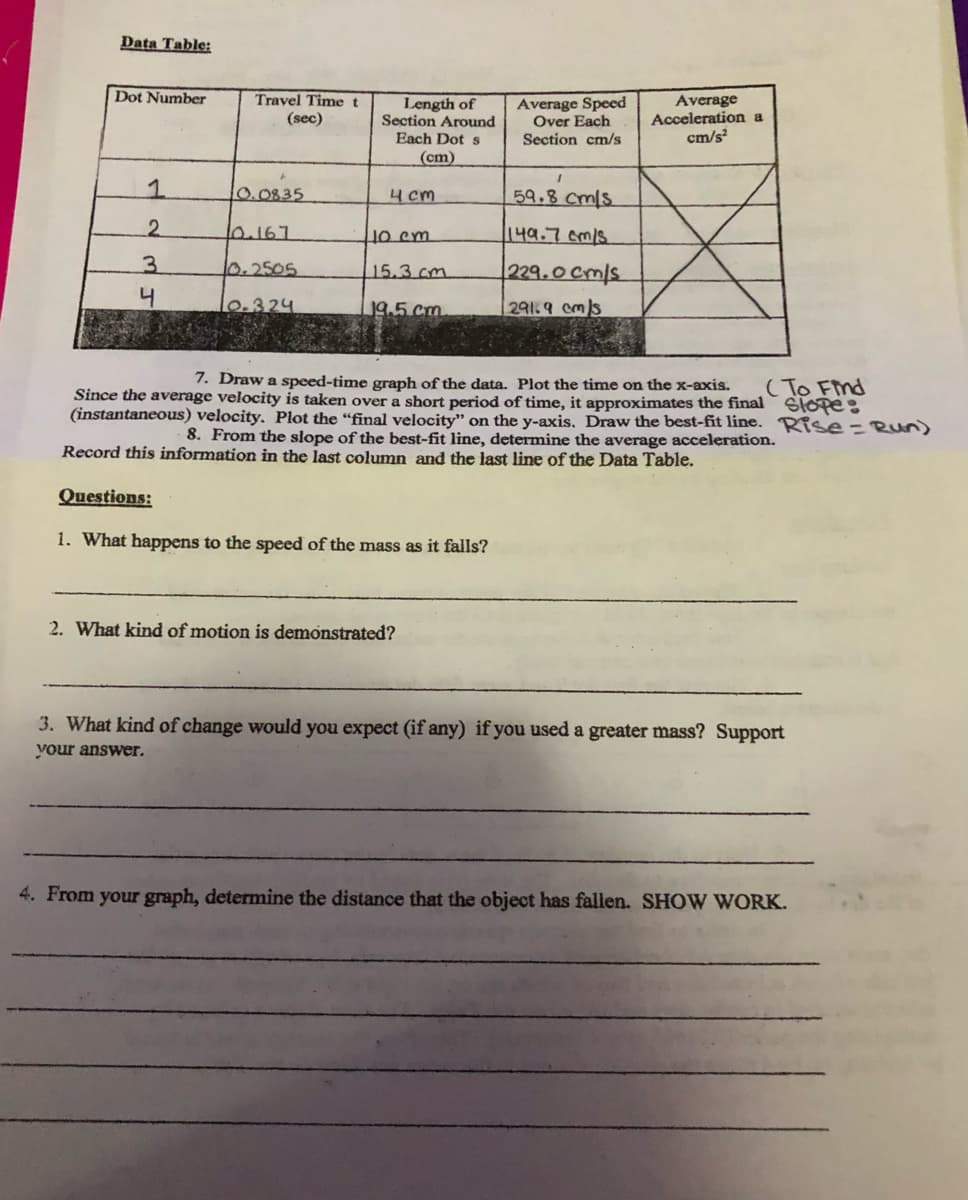
Data Table: Dot Number Travel Timet (sec) Length of Section Around Each Dot s Average Speed Over Each Section cm/s Average Acceleration a cm/s (cm) 1. 0.0835 4 cm 59.8 cmls 2. 10.167 O cm 149.7am/s 3. 10.2505 15.3 cm 229.0 cm/s 0.324 19.5 cm 291.9 cm/s 7. Draw a speed-time graph of the data. Plot the time on the x-axis. Since the average velocity is taken over a short period of time, it approximates the final Stope: (instantaneous) velocity. Plot the "final velocity" on the y-axis. Draw the best-fit line. Rise=Run 8. From the slope of the best-fit line, determine the average acceleration. (To Fnd Record this information in the last column and the last line of the Data Table.
Data Table: Dot Number Travel Timet (sec) Length of Section Around Each Dot s Average Speed Over Each Section cm/s Average Acceleration a cm/s (cm) 1. 0.0835 4 cm 59.8 cmls 2. 10.167 O cm 149.7am/s 3. 10.2505 15.3 cm 229.0 cm/s 0.324 19.5 cm 291.9 cm/s 7. Draw a speed-time graph of the data. Plot the time on the x-axis. Since the average velocity is taken over a short period of time, it approximates the final Stope: (instantaneous) velocity. Plot the "final velocity" on the y-axis. Draw the best-fit line. Rise=Run 8. From the slope of the best-fit line, determine the average acceleration. (To Fnd Record this information in the last column and the last line of the Data Table.

Horizons: Exploring the Universe (MindTap Course List)
14th Edition
ISBN:9781305960961
Author:Michael A. Seeds, Dana Backman
Publisher:Michael A. Seeds, Dana Backman
Chapter11: Neutron Stars And Black Holes
Section: Chapter Questions
Problem 18RQ

Related questions

Concept explainers
Question
can anyone please check if i did number 7 correctly? and i also need help finding the slope of the line of best fit.
slope = rise/run
Transcribed Image Text:Data Table:
Dot Number
Travel Timet
(sec)
Length of
Section Around
Each Dot s
Average Speed
Over Each
Section cm/s
Average
Acceleration a
cm/s
(cm)
0.0835
59.8 cmls
4 cm
2.
10.167
o em
149.7cm/s
3.
10.2505
15.3 cm
229.०cmls
lo.324
19.5 cm
291.9 cm/s
7. Draw a speed-time graph of the data. Plot the time on the x-axis.
Since the average velocity is taken over a short period of time, it approximates the final SlOpe
(instantaneous) velocity. Plot the "final velocity" on the y-axis. Draw the best-fit line. Rise=Run)
8. From the slope of the best-fit line, determine the average acceleration.
(To Fnd
Record this information in the last column and the last line of the Data Table.
Questions:
1. What happens to the speed of the mass as it falls?
2. What kind of motion is demonstrated?
3. What kind of change would you expect (if any) if you used a greater mass? Support
your answer.
4. From your graph, determine the distance that the object has fallen. SHOW WORK.
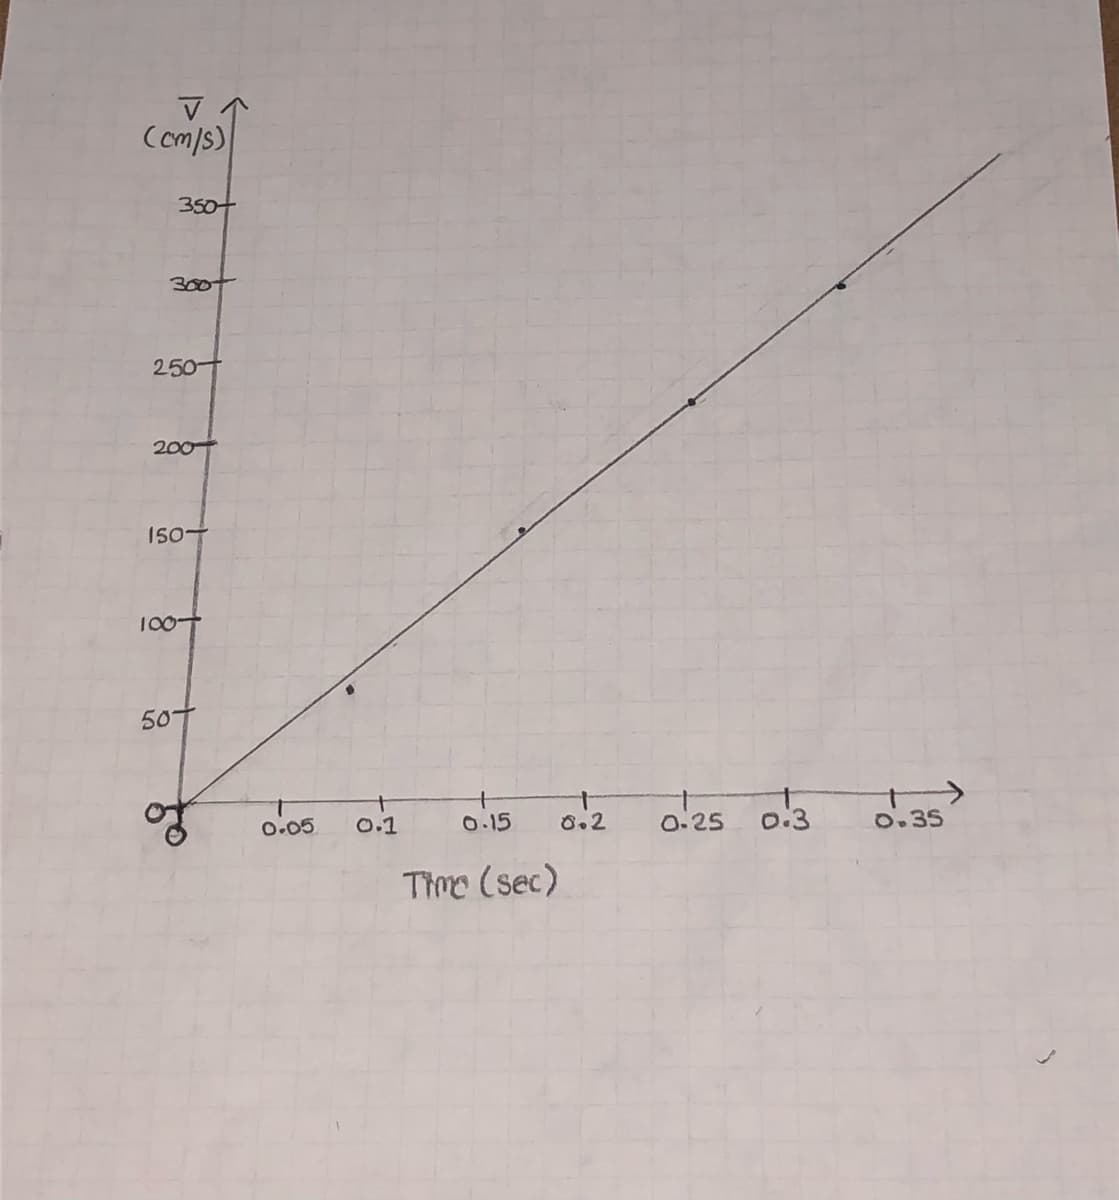
Transcribed Image Text:Com/s)
350
300t
250
200
150
100T
50
0.05
0.1
0.15
8.2
0.25
0:3
0.35
Time (sec)
Expert Solution
This question has been solved!
Explore an expertly crafted, step-by-step solution for a thorough understanding of key concepts.

Step by step
Solved in 2 steps

Knowledge Booster


Learn more about
Need a deep-dive on the concept behind this application? Look no further. Learn more about this topic, physics and related others by exploring similar questions and additional content below.Recommended textbooks for you
Horizons: Exploring the Universe (MindTap Course …
Physics
ISBN:
9781305960961
Author:
Michael A. Seeds, Dana Backman
Publisher:
Cengage Learning
Horizons: Exploring the Universe (MindTap Course …
Physics
ISBN:
9781305960961
Author:
Michael A. Seeds, Dana Backman
Publisher:
Cengage Learning