Table 1. Number of Car Travel per Quarter Year Quarter t y СМА: У 2013 1 1 664924 2013 2 672678 675226 675451.63 674910 680028.25 2013 3 3 2013 4 4 668715 676992 2018 4 24 682681 672746.88 2019 1 25 695917 678078.13 2019 2 26 2019 3 27 Notes: CMA = Centered Moving Average The data is further processed to estimate the seasonality index. Table 2 below shows the Ratio to Moving Average for the observation period. Table 2. Ratio to Moving Average per Quarter Year Q1 Q2 Q3 Q4 2013 .......- 2014 0.9988 1.0004 1.0006 0.9989 2015 1.0017 1.0015 0.9969 1.0049 2016 1.0004 0.9992 1.0041 1.0037 2017 0.9995 1.0078 1.0052 0.9941 2018 0.9866 0.9939 1.0051 0.9940 2019 ......... ...
Table 1. Number of Car Travel per Quarter Year Quarter t y СМА: У 2013 1 1 664924 2013 2 672678 675226 675451.63 674910 680028.25 2013 3 3 2013 4 4 668715 676992 2018 4 24 682681 672746.88 2019 1 25 695917 678078.13 2019 2 26 2019 3 27 Notes: CMA = Centered Moving Average The data is further processed to estimate the seasonality index. Table 2 below shows the Ratio to Moving Average for the observation period. Table 2. Ratio to Moving Average per Quarter Year Q1 Q2 Q3 Q4 2013 .......- 2014 0.9988 1.0004 1.0006 0.9989 2015 1.0017 1.0015 0.9969 1.0049 2016 1.0004 0.9992 1.0041 1.0037 2017 0.9995 1.0078 1.0052 0.9941 2018 0.9866 0.9939 1.0051 0.9940 2019 ......... ...

Chapter12: Sequences, Series And Binomial Theorem
Section12.3: Geometric Sequences And Series
Problem 12.58TI: What is the total effect on the economy of a government tax rebate of $500 to each household in...

Related questions
Question
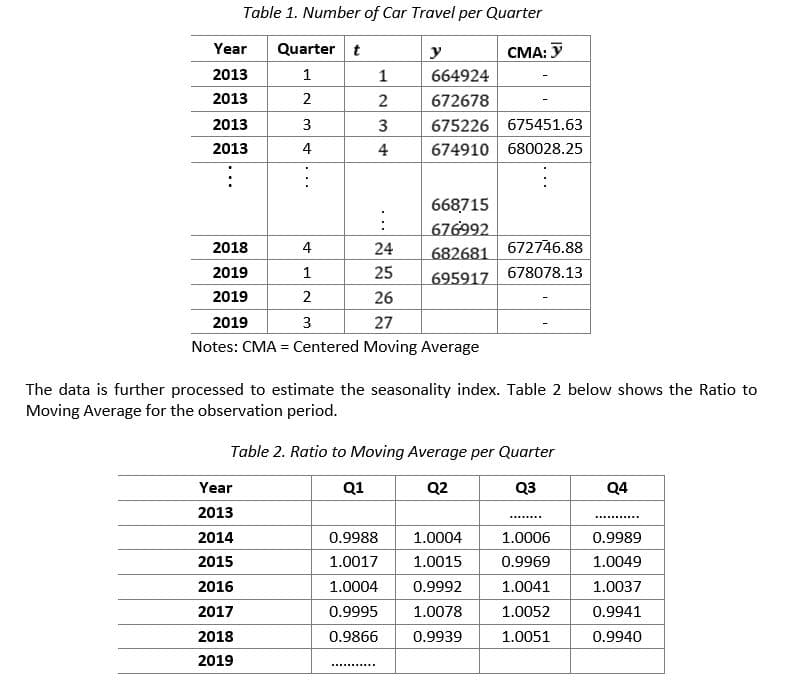
Samurai Inc is a popular travel option for travelers between Japan and mainland Asia especially South Korea. However, due to the South Korea’s Discord with its neighbour and the following uncertainty regarding peace negotiation in the Korean Peninsula, the number of ground travel continues to fluctuate. Table 1 shows the number of car travel (y) per quarter between Japan and South Korea between 2013 and 2019.
Table Attached
Question:
Calculate the Adjusted Seasonal Index for Q1, Q2, Q3, and Q4.
Transcribed Image Text:Table 1. Number of Car Travel per Quarter
Year
Quarter t
y
СМА: У
2013
1
1
664924
2013
2
2
672678
675226 675451.63
674910 680028.25
2013
3
3
2013
4
4
668715
676992
2018
4
24
682681
672746.88
2019
1
25
695917 678078.13
2019
2
26
2019
3
27
Notes: CMA = Centered Moving Average
The data is further processed to estimate the seasonality index. Table 2 below shows the Ratio to
Moving Average for the observation period.
Table 2. Ratio to Moving Average per Quarter
Year
Q1
Q2
Q3
Q4
2013
2014
0.9988
1.0004
1.0006
0.9989
2015
1.0017
1.0015
0.9969
1.0049
2016
1.0004
0.9992
1.0041
1.0037
2017
0.9995
1.0078
1.0052
0.9941
2018
0.9866
0.9939
1.0051
0.9940
2019
............
...
Expert Solution
This question has been solved!
Explore an expertly crafted, step-by-step solution for a thorough understanding of key concepts.

Step by step
Solved in 2 steps with 2 images

Knowledge Booster


Learn more about
Need a deep-dive on the concept behind this application? Look no further. Learn more about this topic, statistics and related others by exploring similar questions and additional content below.Recommended textbooks for you