TABLE 2 shows the probability distribution of X number of new handphone sold per day at a cellular phone company kiosk. TABLE 2 8 9 10 P(X = x) | 0.03 0.08 0.15 0.20 6 7 11 12 13 14 0.19 | 0.16| 0.10 | 0.07| 0.02 a. Show that the above distribution is a probability distribution of the random variable X. b. Find the probability that the worker at the kiosk to sell at least 10 new handphones per day. Is it possible for the worker at the kiosk to sell more than 14 new handphones? Justify your с.
TABLE 2 shows the probability distribution of X number of new handphone sold per day at a cellular phone company kiosk. TABLE 2 8 9 10 P(X = x) | 0.03 0.08 0.15 0.20 6 7 11 12 13 14 0.19 | 0.16| 0.10 | 0.07| 0.02 a. Show that the above distribution is a probability distribution of the random variable X. b. Find the probability that the worker at the kiosk to sell at least 10 new handphones per day. Is it possible for the worker at the kiosk to sell more than 14 new handphones? Justify your с.

MATLAB: An Introduction with Applications
6th Edition
ISBN:9781119256830
Author:Amos Gilat
Publisher:Amos Gilat
Chapter1: Starting With Matlab
Section: Chapter Questions
Problem 1P

Related questions
Question
100%
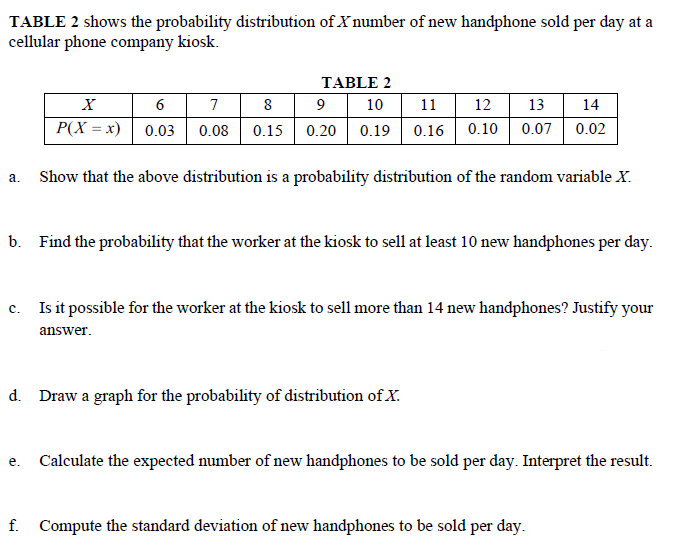
Transcribed Image Text:TABLE 2 shows the probability distribution of X number of new handphone sold per day at a
cellular phone company kiosk.
TABLE 2
6
9 10
0.19 0.16| 0.10 | 0.07| 0.02
7
8
11
12
13
14
P(X = x)
0.03 0.08 0.15 0.20
Show that the above distribution is a probability distribution of the random variable X.
a.
b. Find the probability that the worker at the kiosk to sell at least 10 new handphones per day.
c. Is it possible for the worker at the kiosk to sell more than 14 new handphones? Justify your
answer.
d. Draw a graph for the probability of distribution of X.
e. Calculate the expected number of new handphones to be sold per day. Interpret the result.
f. Compute the standard deviation of new handphones to be sold per day.
Expert Solution
This question has been solved!
Explore an expertly crafted, step-by-step solution for a thorough understanding of key concepts.

Step by step
Solved in 2 steps

Recommended textbooks for you
MATLAB: An Introduction with Applications
Statistics
ISBN:
9781119256830
Author:
Amos Gilat
Publisher:
John Wiley & Sons Inc

Probability and Statistics for Engineering and th…
Statistics
ISBN:
9781305251809
Author:
Jay L. Devore
Publisher:
Cengage Learning

Statistics for The Behavioral Sciences (MindTap C…
Statistics
ISBN:
9781305504912
Author:
Frederick J Gravetter, Larry B. Wallnau
Publisher:
Cengage Learning
MATLAB: An Introduction with Applications
Statistics
ISBN:
9781119256830
Author:
Amos Gilat
Publisher:
John Wiley & Sons Inc
Probability and Statistics for Engineering and th…
Statistics
ISBN:
9781305251809
Author:
Jay L. Devore
Publisher:
Cengage Learning
Statistics for The Behavioral Sciences (MindTap C…
Statistics
ISBN:
9781305504912
Author:
Frederick J Gravetter, Larry B. Wallnau
Publisher:
Cengage Learning

Elementary Statistics: Picturing the World (7th E…
Statistics
ISBN:
9780134683416
Author:
Ron Larson, Betsy Farber
Publisher:
PEARSON

The Basic Practice of Statistics
Statistics
ISBN:
9781319042578
Author:
David S. Moore, William I. Notz, Michael A. Fligner
Publisher:
W. H. Freeman

Introduction to the Practice of Statistics
Statistics
ISBN:
9781319013387
Author:
David S. Moore, George P. McCabe, Bruce A. Craig
Publisher:
W. H. Freeman