Table 7.6 Price per Unitin 2015 Units Purchased 2014 2016 Good A $100 $2.00 $1.50 242.50 $150 Good B 10 $3.00 Good C $4.00 $450 $5.00 Refer to Table 7.6. If 2015 is the base year, the price index in 2015 is
Table 7.6 Price per Unitin 2015 Units Purchased 2014 2016 Good A $100 $2.00 $1.50 242.50 $150 Good B 10 $3.00 Good C $4.00 $450 $5.00 Refer to Table 7.6. If 2015 is the base year, the price index in 2015 is

MATLAB: An Introduction with Applications
6th Edition
ISBN:9781119256830
Author:Amos Gilat
Publisher:Amos Gilat
Chapter1: Starting With Matlab
Section: Chapter Questions
Problem 1P

Related questions
Question
1
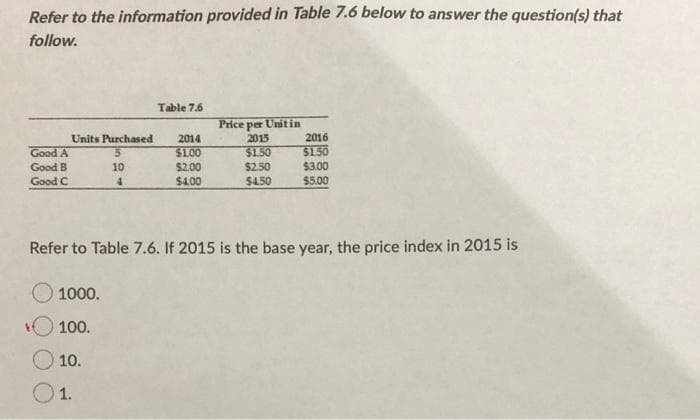
Transcribed Image Text:Refer to the information provided in Table 7.6 below to answer the question(s) that
follow.
Table 7.6
Price per
Unitin
2016
$1.50
$3.00
$5.00
Units Purchased
2014
2015
Good A
Good B
$1.00
$2.00
$4.00
$1.50
$2.50
$4.50
10
Good C
Refer to Table 7.6. If 2015 is the base year, the price index in 2015 is
1000.
100.
10.
O1.
Expert Solution
This question has been solved!
Explore an expertly crafted, step-by-step solution for a thorough understanding of key concepts.

This is a popular solution!

Trending now
This is a popular solution!

Step by step
Solved in 2 steps

Recommended textbooks for you
MATLAB: An Introduction with Applications
Statistics
ISBN:
9781119256830
Author:
Amos Gilat
Publisher:
John Wiley & Sons Inc

Probability and Statistics for Engineering and th…
Statistics
ISBN:
9781305251809
Author:
Jay L. Devore
Publisher:
Cengage Learning

Statistics for The Behavioral Sciences (MindTap C…
Statistics
ISBN:
9781305504912
Author:
Frederick J Gravetter, Larry B. Wallnau
Publisher:
Cengage Learning
MATLAB: An Introduction with Applications
Statistics
ISBN:
9781119256830
Author:
Amos Gilat
Publisher:
John Wiley & Sons Inc
Probability and Statistics for Engineering and th…
Statistics
ISBN:
9781305251809
Author:
Jay L. Devore
Publisher:
Cengage Learning
Statistics for The Behavioral Sciences (MindTap C…
Statistics
ISBN:
9781305504912
Author:
Frederick J Gravetter, Larry B. Wallnau
Publisher:
Cengage Learning

Elementary Statistics: Picturing the World (7th E…
Statistics
ISBN:
9780134683416
Author:
Ron Larson, Betsy Farber
Publisher:
PEARSON

The Basic Practice of Statistics
Statistics
ISBN:
9781319042578
Author:
David S. Moore, William I. Notz, Michael A. Fligner
Publisher:
W. H. Freeman

Introduction to the Practice of Statistics
Statistics
ISBN:
9781319013387
Author:
David S. Moore, George P. McCabe, Bruce A. Craig
Publisher:
W. H. Freeman