Tabor Company has just prepared the following comparative annual financial statements for the current year: TABOR COMPANY Comparative Income Statement For the Years Ended December 31 Sales revenue (one-half on credit) Cost of goods sold Gross profit Expenses (including $7,200 interest expense each year). Pretax income Income tax expense (30%) Net income Assets Cash Accounts receivable Inventory Property & equipment (net) Total assets TABOR COMPANY Comparative Balance Sheet At December 31 Liabilities Accounts payable Income taxes payable. Note payable, long-term Stockholders' equity Capital stock ($5 par value) Retained earnings Total liabilities and stockholders' equity Current Year Prior Year $ 198,000 $ 257,400 124,800 93,600 104,400 72,000 32,400 9,720 $ 22,680 Current Year $ 51,100 61,000 28,200 103,000 $ 243,300 $ 43,400 2,600 56,000 98,000 43,300 $ 243,300 132,600 96,200 36,400 10,920 $ 25,480 Prior Year $ 39,600 40,000 44,400 121,000 $ 245,000 $ 46,200 1,300 56,000 106,000 35,500 $ 245,000
Tabor Company has just prepared the following comparative annual financial statements for the current year: TABOR COMPANY Comparative Income Statement For the Years Ended December 31 Sales revenue (one-half on credit) Cost of goods sold Gross profit Expenses (including $7,200 interest expense each year). Pretax income Income tax expense (30%) Net income Assets Cash Accounts receivable Inventory Property & equipment (net) Total assets TABOR COMPANY Comparative Balance Sheet At December 31 Liabilities Accounts payable Income taxes payable. Note payable, long-term Stockholders' equity Capital stock ($5 par value) Retained earnings Total liabilities and stockholders' equity Current Year Prior Year $ 198,000 $ 257,400 124,800 93,600 104,400 72,000 32,400 9,720 $ 22,680 Current Year $ 51,100 61,000 28,200 103,000 $ 243,300 $ 43,400 2,600 56,000 98,000 43,300 $ 243,300 132,600 96,200 36,400 10,920 $ 25,480 Prior Year $ 39,600 40,000 44,400 121,000 $ 245,000 $ 46,200 1,300 56,000 106,000 35,500 $ 245,000

Managerial Accounting: The Cornerstone of Business Decision-Making
7th Edition
ISBN:9781337115773
Author:Maryanne M. Mowen, Don R. Hansen, Dan L. Heitger
Publisher:Maryanne M. Mowen, Don R. Hansen, Dan L. Heitger
Chapter15: Financial Statement Analysis
Section: Chapter Questions
Problem 52E: Juroe Company provided the following income statement for last year: Juroes balance sheet as of...

Related questions
Question
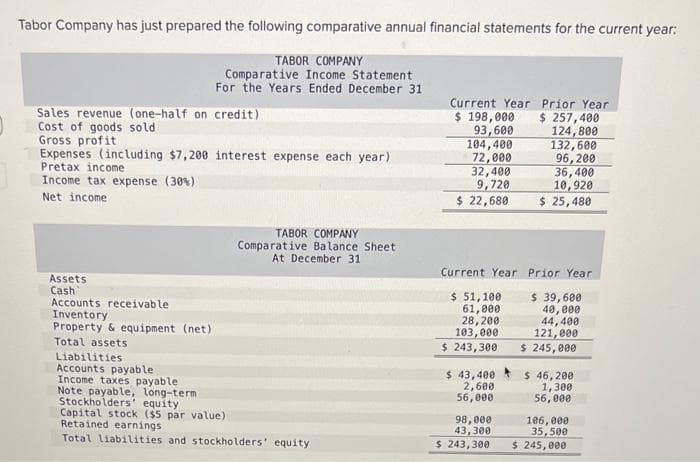
Transcribed Image Text:Tabor Company has just prepared the following comparative annual financial statements for the current year:
TABOR COMPANY
Comparative Income Statement
For the Years Ended December 31
Sales revenue (one-half on credit)
Cost of goods sold.
Gross profit
Expenses (including $7,200 interest expense each year).
Pretax income
Income tax expense (30%)
Net income
Assets
Cash
Accounts receivable
Inventory
Property & equipment (net)
Total assets
Liabilities
Accounts payable
Income taxes payable
Note payable, long-term
Stockholders' equity
TABOR COMPANY
Comparative Balance Sheet
At December 31
Capital stock ($5 par value)
Retained earnings
Total liabilities and stockholders' equity
Current Year Prior Year
$ 198,000
$ 257,400
93,600
124,800
132,600
96,200
36,400
10,920
$ 25,480
104,400
72,000
32,400
9,720
$ 22,680
Current Year
$ 51,100
61,000
28,200
103,000
$ 243,300
$ 43,400
2,600
56,000
98,000
43,300
$ 243,300
Prior Year
$ 39,600
40,000
44,400
121,000
$ 245,000
$ 46,200
1,300
56,000
106,000
35,500
$ 245,000
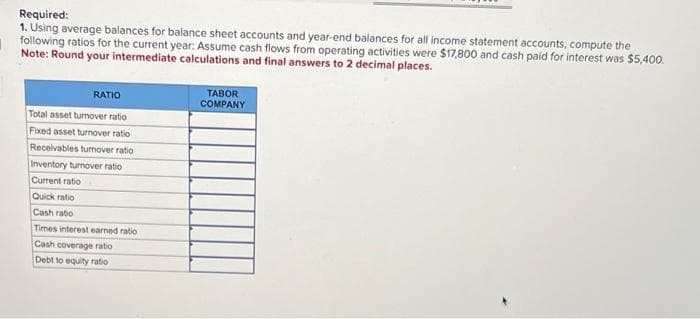
Transcribed Image Text:Required:
1. Using average balances for balance sheet accounts and year-end balances for all income statement accounts, compute the
following ratios for the current year: Assume cash flows from operating activities were $17,800 and cash paid for interest was $5,400.
Note: Round your intermediate calculations and final answers to 2 decimal places.
RATIO
Total asset turnover ratio
Fixed asset turnover ratio
Receivables tumover ratio
Inventory turnover ratio
Current ratio
Quick ratio
Cash ratio
Times interest earned ratio
Cash coverage ratio
Debt to equity ratio
TABOR
COMPANY
Expert Solution
This question has been solved!
Explore an expertly crafted, step-by-step solution for a thorough understanding of key concepts.

Step by step
Solved in 6 steps

Knowledge Booster


Learn more about
Need a deep-dive on the concept behind this application? Look no further. Learn more about this topic, accounting and related others by exploring similar questions and additional content below.Recommended textbooks for you
Managerial Accounting: The Cornerstone of Busines…
Accounting
ISBN:
9781337115773
Author:
Maryanne M. Mowen, Don R. Hansen, Dan L. Heitger
Publisher:
Cengage Learning

Managerial Accounting
Accounting
ISBN:
9781337912020
Author:
Carl Warren, Ph.d. Cma William B. Tayler
Publisher:
South-Western College Pub

Intermediate Accounting: Reporting And Analysis
Accounting
ISBN:
9781337788281
Author:
James M. Wahlen, Jefferson P. Jones, Donald Pagach
Publisher:
Cengage Learning
Managerial Accounting: The Cornerstone of Busines…
Accounting
ISBN:
9781337115773
Author:
Maryanne M. Mowen, Don R. Hansen, Dan L. Heitger
Publisher:
Cengage Learning
Managerial Accounting
Accounting
ISBN:
9781337912020
Author:
Carl Warren, Ph.d. Cma William B. Tayler
Publisher:
South-Western College Pub
Intermediate Accounting: Reporting And Analysis
Accounting
ISBN:
9781337788281
Author:
James M. Wahlen, Jefferson P. Jones, Donald Pagach
Publisher:
Cengage Learning

Financial Accounting
Accounting
ISBN:
9781305088436
Author:
Carl Warren, Jim Reeve, Jonathan Duchac
Publisher:
Cengage Learning
