Team Yds/Att WinPct Arizona Cardinals 6.5 50 Atlanta Falcons 7.1 63 Carolina Panthers 7.4 38 Chicago Bears Dallas Cowboys New England Patriots Philadelphia Eagles Seattle Seahawks 6.4 50 7.4 50 8.3 81 7.4 50 6.1 44 St. Louis Rams Tampa Bay Buccaneers 5.2 13 6.2 25 a. Develop a scatter diagram with the number of passing yards per attempt on the horizontal axis and the percentage of games won on the vertical axis. b. What does the scatter diagram developed in part (a) indicate about the relationship between the two variables? c. Develop the estimated regression equation that could be used to predict the percent- age of games won given the average number of passing yards per attempt. d. Provide an interpretation for the slope of the estimated regression equation. e. For the 2011 season, the average number of passing yards per attempt for the Kan- sas City Chiefs was 6.2. Use the estimated regression equation developed in part (c) to predict the percentage of games won by the Kansas City Chiefs. (Note: For the 2011 season the Kansas City Chiefs record was 7 wins and 9 losses.) Compare your prediction to the actual percentage of games won by the Kansas City Chiefs.
Team Yds/Att WinPct Arizona Cardinals 6.5 50 Atlanta Falcons 7.1 63 Carolina Panthers 7.4 38 Chicago Bears Dallas Cowboys New England Patriots Philadelphia Eagles Seattle Seahawks 6.4 50 7.4 50 8.3 81 7.4 50 6.1 44 St. Louis Rams Tampa Bay Buccaneers 5.2 13 6.2 25 a. Develop a scatter diagram with the number of passing yards per attempt on the horizontal axis and the percentage of games won on the vertical axis. b. What does the scatter diagram developed in part (a) indicate about the relationship between the two variables? c. Develop the estimated regression equation that could be used to predict the percent- age of games won given the average number of passing yards per attempt. d. Provide an interpretation for the slope of the estimated regression equation. e. For the 2011 season, the average number of passing yards per attempt for the Kan- sas City Chiefs was 6.2. Use the estimated regression equation developed in part (c) to predict the percentage of games won by the Kansas City Chiefs. (Note: For the 2011 season the Kansas City Chiefs record was 7 wins and 9 losses.) Compare your prediction to the actual percentage of games won by the Kansas City Chiefs.

Glencoe Algebra 1, Student Edition, 9780079039897, 0079039898, 2018
18th Edition
ISBN:9780079039897
Author:Carter
Publisher:Carter
Chapter10: Statistics
Section10.3: Measures Of Spread
Problem 1GP

Related questions
Question
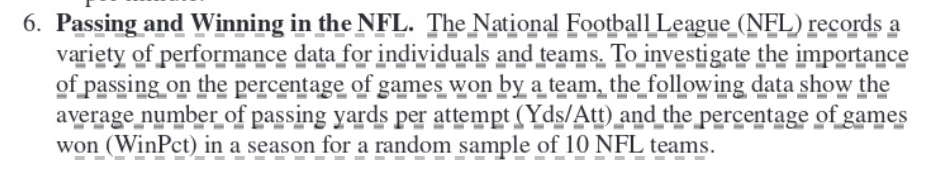
Transcribed Image Text:6. Passing and Winning in the NFL. The National Football League (NFL) records a
variety of performance data for individuals and teams. To investigate the importance
of passing on the percentage of games won by a team, the_following data show the
average number of passing yards per attempt (Yds/Att) and the percentage of games
won (WinPct) in a season for a random sample of 10 NFL teams.
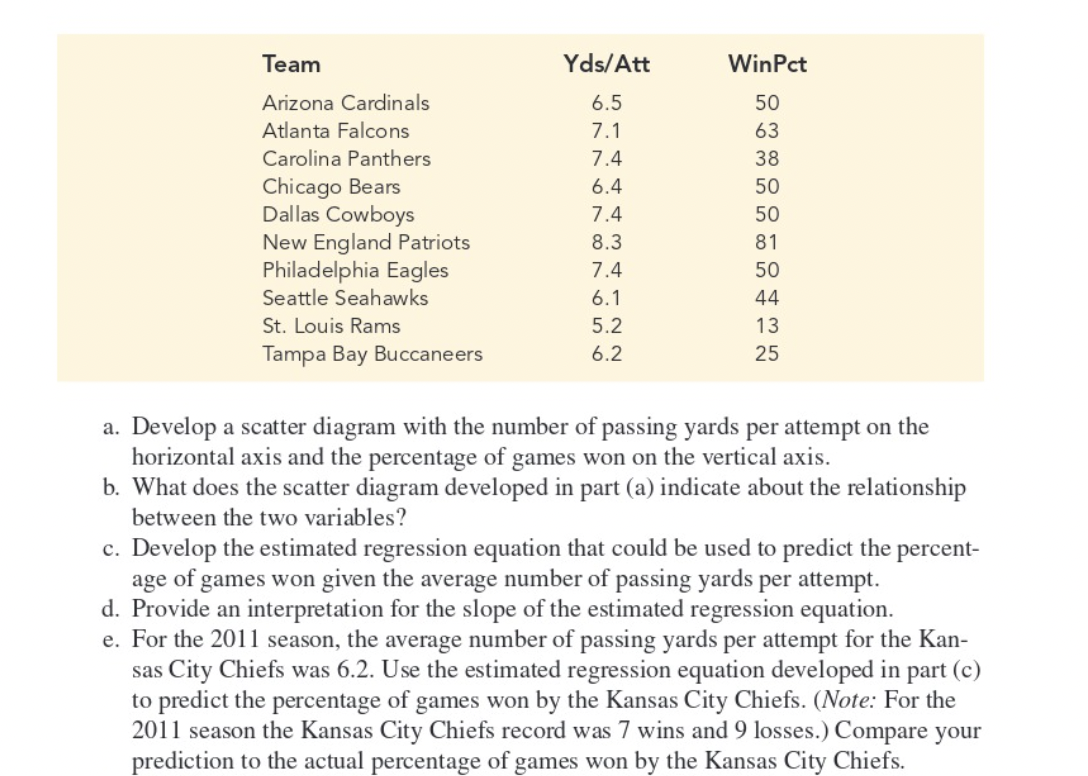
Transcribed Image Text:Team
Yds/Att
WinPct
Arizona Cardinals
6.5
50
Atlanta Falcons
7.1
63
Carolina Panthers
7.4
38
Chicago Bears
Dallas Cowboys
New England Patriots
Philadelphia Eagles
6.4
50
7.4
50
8.3
81
7.4
50
Seattle Seahawks
6.1
44
St. Louis Rams
5.2
13
Tampa Bay Buccaneers
6.2
25
a. Develop a scatter diagram with the number of passing yards per attempt on the
horizontal axis and the percentage of games won on the vertical axis.
b. What does the scatter diagram developed in part (a) indicate about the relationship
between the two variables?
c. Develop the estimated regression equation that could be used to predict the percent-
age of games won given the average number of passing yards per attempt.
d. Provide an interpretation for the slope of the estimated regression equation.
e. For the 2011 season, the average number of passing yards per attempt for the Kan-
sas City Chiefs was 6.2. Use the estimated regression equation developed in part (c)
to predict the percentage of games won by the Kansas City Chiefs. (Note: For the
2011 season the Kansas City Chiefs record was 7 wins and 9 losses.) Compare your
prediction to the actual percentage of games won by the Kansas City Chiefs.
Expert Solution
This question has been solved!
Explore an expertly crafted, step-by-step solution for a thorough understanding of key concepts.

This is a popular solution!

Trending now
This is a popular solution!

Step by step
Solved in 2 steps with 3 images

Recommended textbooks for you
Glencoe Algebra 1, Student Edition, 9780079039897…
Algebra
ISBN:
9780079039897
Author:
Carter
Publisher:
McGraw Hill

College Algebra (MindTap Course List)
Algebra
ISBN:
9781305652231
Author:
R. David Gustafson, Jeff Hughes
Publisher:
Cengage Learning
Glencoe Algebra 1, Student Edition, 9780079039897…
Algebra
ISBN:
9780079039897
Author:
Carter
Publisher:
McGraw Hill
College Algebra (MindTap Course List)
Algebra
ISBN:
9781305652231
Author:
R. David Gustafson, Jeff Hughes
Publisher:
Cengage Learning