Temperature, °C 100 80 60 40 20 0 -20 -40 Volume, liters 2.98 2.87 2.68 2.53 2.33 2.21 2.07 1.88 Using graphing software, set up your graph with volume ranging from 0 to 3 liters on the vertical axis, and temperature ranging from -350 to +100°C on the horizontal axis. Plot the experimental data given above and draw the best straight line. Extend the line to the point where the volume is zero. This is the experimental value for absolute zero in degrees Celsius. Remember to label your axes and to give your graph a title. Attach your graph to this question sheet. Experimental value for absolute zero = °C
Temperature, °C 100 80 60 40 20 0 -20 -40 Volume, liters 2.98 2.87 2.68 2.53 2.33 2.21 2.07 1.88 Using graphing software, set up your graph with volume ranging from 0 to 3 liters on the vertical axis, and temperature ranging from -350 to +100°C on the horizontal axis. Plot the experimental data given above and draw the best straight line. Extend the line to the point where the volume is zero. This is the experimental value for absolute zero in degrees Celsius. Remember to label your axes and to give your graph a title. Attach your graph to this question sheet. Experimental value for absolute zero = °C

Chapter14: Principles Of Neutralization Titrations
Section: Chapter Questions
Problem 14.47QAP

Related questions
Question
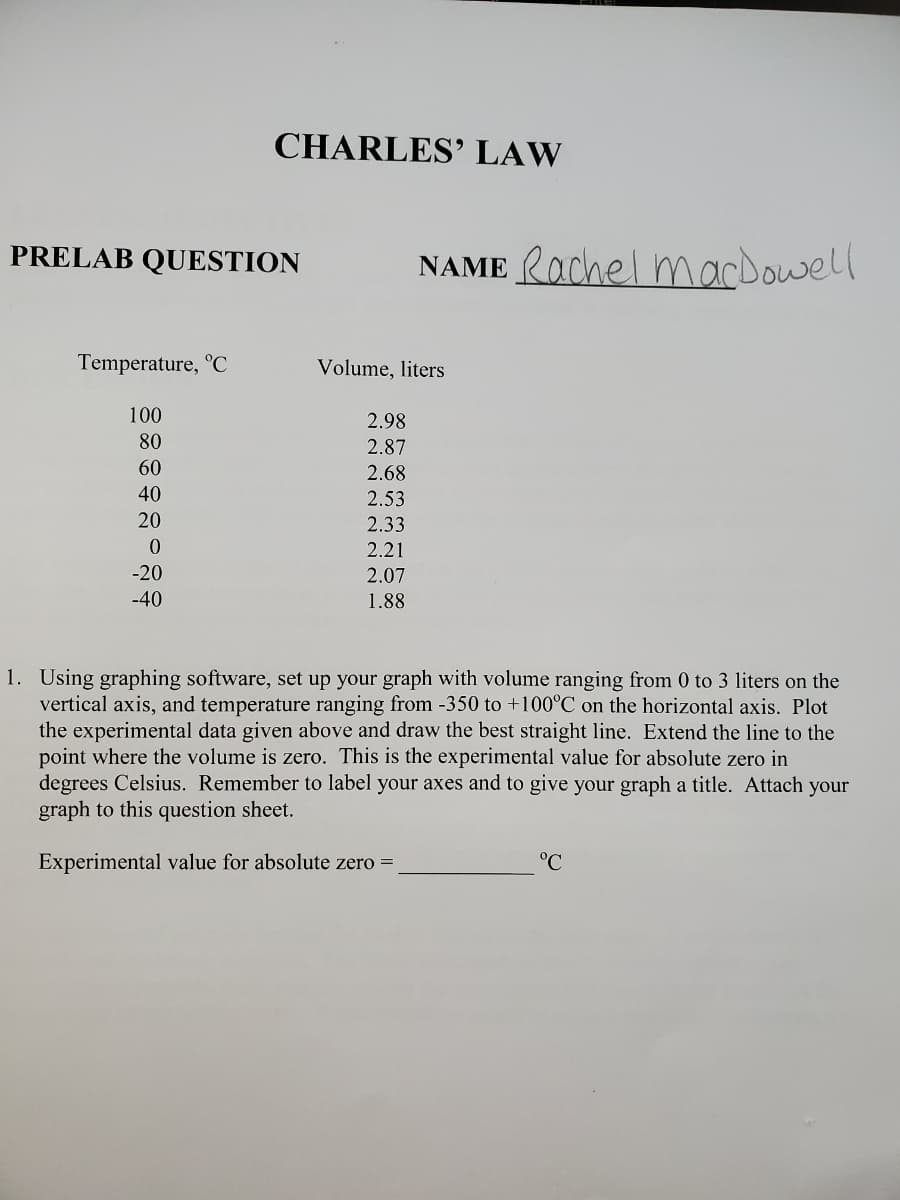
Transcribed Image Text:PRELAB QUESTION NAME Rachel macDowell
Temperature, °C
CHARLES' LAW
100
80
60
40
20
0
-20
-40
Volume, liters
2.98
2.87
2.68
2.53
2.33
2.21
2.07
1.88
1. Using graphing software, set up your graph with volume ranging from 0 to 3 liters on the
vertical axis, and temperature ranging from -350 to +100°C on the horizontal axis. Plot
the experimental data given above and draw the best straight line. Extend the line to the
point where the volume is zero. This the experimental value for absolute zero in
degrees Celsius. Remember to label your axes and to give your graph a title. Attach your
graph to this question sheet.
Experimental value for absolute zero
°℃
Expert Solution
This question has been solved!
Explore an expertly crafted, step-by-step solution for a thorough understanding of key concepts.

This is a popular solution!

Trending now
This is a popular solution!

Step by step
Solved in 4 steps with 3 images

Knowledge Booster


Learn more about
Need a deep-dive on the concept behind this application? Look no further. Learn more about this topic, chemistry and related others by exploring similar questions and additional content below.Recommended textbooks for you