Ten engineering schools in a country were surveyed. The sample contained 275 electrical engineers, 80 being women; 175 chemical engineers, 20 being women. Compute a 90% confidence interval for the difference between the proportions of women in these two fields of engineering. Is there a significant difference between the two proportions? Click bero to view nage 1 of the standard normal distribuition table Let p, be the population proportion of electrical engineers that are women in the schools that were surveyed and let p, be the population proportion of chemical engineers that are women in the schools that were surveyed. The 90% confidence interval is
Ten engineering schools in a country were surveyed. The sample contained 275 electrical engineers, 80 being women; 175 chemical engineers, 20 being women. Compute a 90% confidence interval for the difference between the proportions of women in these two fields of engineering. Is there a significant difference between the two proportions? Click bero to view nage 1 of the standard normal distribuition table Let p, be the population proportion of electrical engineers that are women in the schools that were surveyed and let p, be the population proportion of chemical engineers that are women in the schools that were surveyed. The 90% confidence interval is

College Algebra (MindTap Course List)
12th Edition
ISBN:9781305652231
Author:R. David Gustafson, Jeff Hughes
Publisher:R. David Gustafson, Jeff Hughes
Chapter8: Sequences, Series, And Probability
Section8.7: Probability
Problem 58E: What is meant by the sample space of an experiment?

Related questions

Topic Video
Question
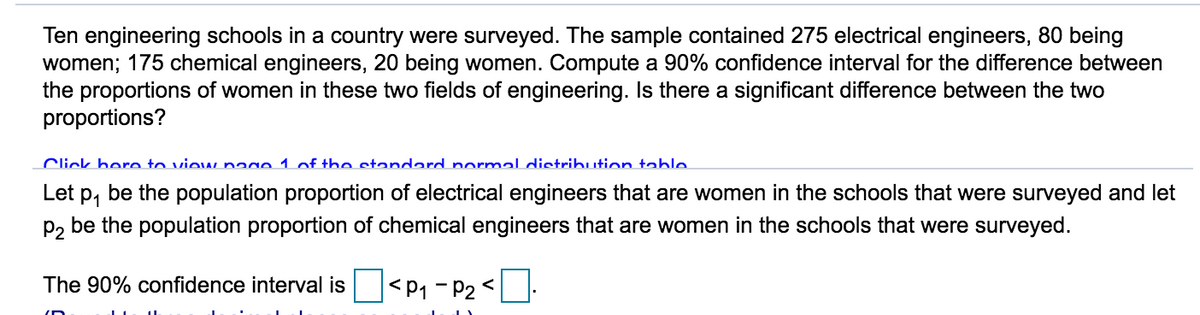
Transcribed Image Text:Ten engineering schools in a country were surveyed. The sample contained 275 electrical engineers, 80 being
women; 175 chemical engineers, 20 being women. Compute a 90% confidence interval for the difference between
the proportions of women in these two fields of engineering. Is there a significant difference between the two
proportions?
Click hero to view nage 1 of the standard normal distribution table
Let p, be the population proportion of electrical engineers that are women in the schools that were surveyed and let
P2 be the population proportion of chemical engineers that are women in the schools that were surveyed.
The 90% confidence interval is
|<P1 - P2 <
Expert Solution
This question has been solved!
Explore an expertly crafted, step-by-step solution for a thorough understanding of key concepts.

This is a popular solution!

Trending now
This is a popular solution!

Step by step
Solved in 2 steps

Knowledge Booster


Learn more about
Need a deep-dive on the concept behind this application? Look no further. Learn more about this topic, statistics and related others by exploring similar questions and additional content below.Recommended textbooks for you
College Algebra (MindTap Course List)
Algebra
ISBN:
9781305652231
Author:
R. David Gustafson, Jeff Hughes
Publisher:
Cengage Learning
College Algebra (MindTap Course List)
Algebra
ISBN:
9781305652231
Author:
R. David Gustafson, Jeff Hughes
Publisher:
Cengage Learning