Tesearcher in the team, has randomly selected a sample of 25 male runners from a high school and the time (in seconds) for each of them to complete a 400-meter race was recorded. The sample mean running time was 53 seconds. It is assumed that the running time in a 400-meter race follows a normal distribution with a population standard deviation of 5.5 seconds. (a) Give a point estimate of the population mean running time for a 400-meter race. (b) Calculate the sampling error at 95% confidence level. (c) Construct a 95% confidence interval estimate of the population mean running time for a 400-meter race. (d) If instead of 25, 80 male runners are selected for the study, what is the sampling error at 95% confidence level? When the 95% confidence interval is constructed based on a sample with 80 male runners, would you expect the interval will be (I) narrower, (II) wider, or (III) the same width as the confidence interval constructed in part (c)? (e) After discussion with the research director, Jimmy is asked to work on the research again. This time, he needs to ensure the difference between the point estimate and the true population mean be within +0.8 seconds at 99% confidence level. To fulfil the requirement, how large should be the minimum sample size?
Tesearcher in the team, has randomly selected a sample of 25 male runners from a high school and the time (in seconds) for each of them to complete a 400-meter race was recorded. The sample mean running time was 53 seconds. It is assumed that the running time in a 400-meter race follows a normal distribution with a population standard deviation of 5.5 seconds. (a) Give a point estimate of the population mean running time for a 400-meter race. (b) Calculate the sampling error at 95% confidence level. (c) Construct a 95% confidence interval estimate of the population mean running time for a 400-meter race. (d) If instead of 25, 80 male runners are selected for the study, what is the sampling error at 95% confidence level? When the 95% confidence interval is constructed based on a sample with 80 male runners, would you expect the interval will be (I) narrower, (II) wider, or (III) the same width as the confidence interval constructed in part (c)? (e) After discussion with the research director, Jimmy is asked to work on the research again. This time, he needs to ensure the difference between the point estimate and the true population mean be within +0.8 seconds at 99% confidence level. To fulfil the requirement, how large should be the minimum sample size?

Holt Mcdougal Larson Pre-algebra: Student Edition 2012
1st Edition
ISBN:9780547587776
Author:HOLT MCDOUGAL
Publisher:HOLT MCDOUGAL
Chapter11: Data Analysis And Probability
Section: Chapter Questions
Problem 7MCQ

Related questions
Question
Transcribed Image Text:三转文档
日单页 D双页、工连续阅读
背景,划词翻译
截屏。压缩全屏显示
播放
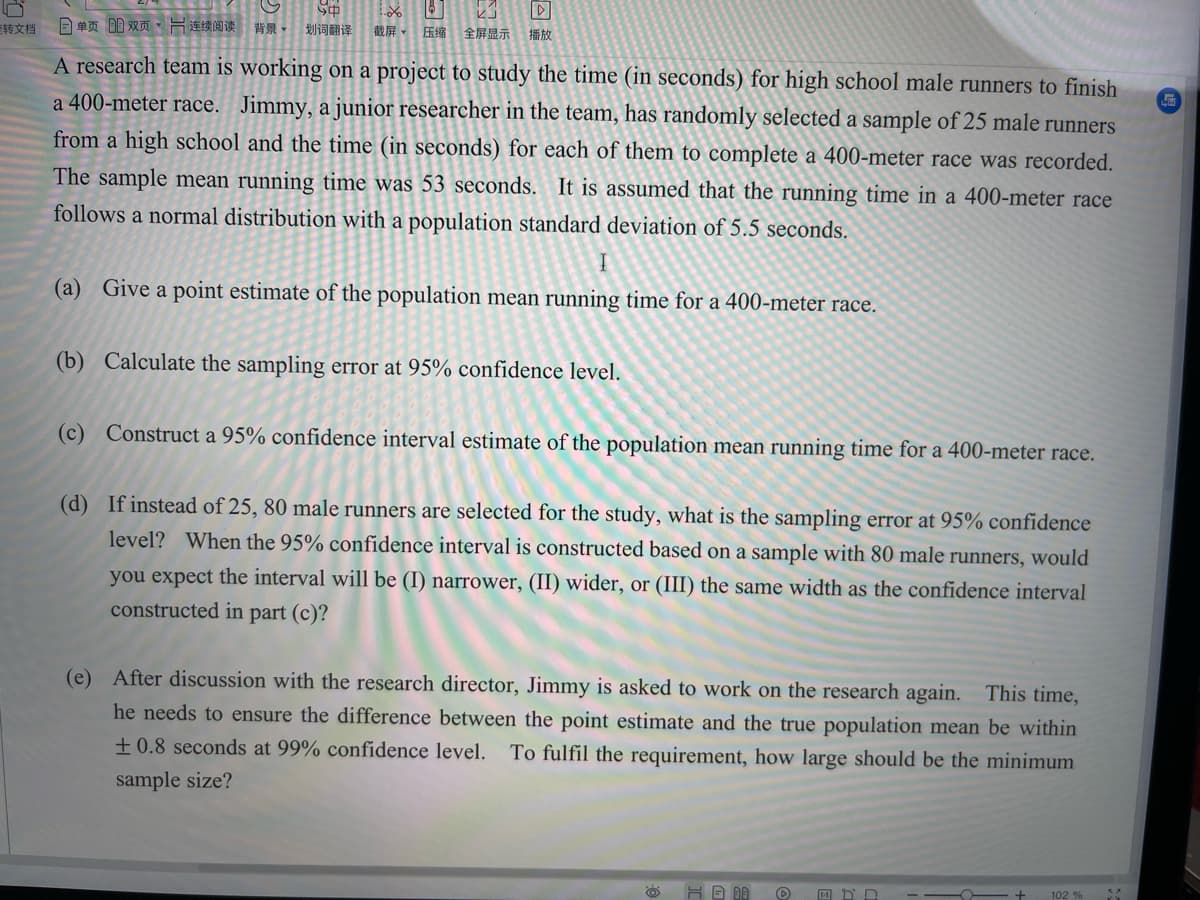
A research team is working on a project to study the time (in seconds) for high school male runners to finish
a 400-meter race. Jimmy, a junior researcher in the team, has randomly selected a sample of 25 male runners
from a high school and the time (in seconds) for each of them to complete a 400-meter race was recorded.
The sample mean running time was 53 seconds. It is assumed that the running time in a 400-meter race
follows a normal distribution with a population standard deviation of 5.5 seconds.
(a) Give a point estimate of the population mean running time for a 400-meter race.
(b) Calculate the sampling error at 95% confidence level.
(c) Construct a 95% confidence interval estimate of the population mean running time for a 400-meter race.
(d) If instead of 25, 80 male runners are selected for the study, what is the sampling error at 95% confidence
level? When the 95% confidence interval is constructed based on a sample with 80 male runners, would
you expect the interval will be (I) narrower, (II) wider, or (III) the same width as the confidence interval
constructed in part (c)?
(e) After discussion with the research director, Jimmy is asked to work on the research again. This time,
he needs to ensure the difference between the point estimate and the true population mean be within
±0.8 seconds at 99% confidence level. To fulfil the requirement, how large should be the minimum
sample size?
102 %
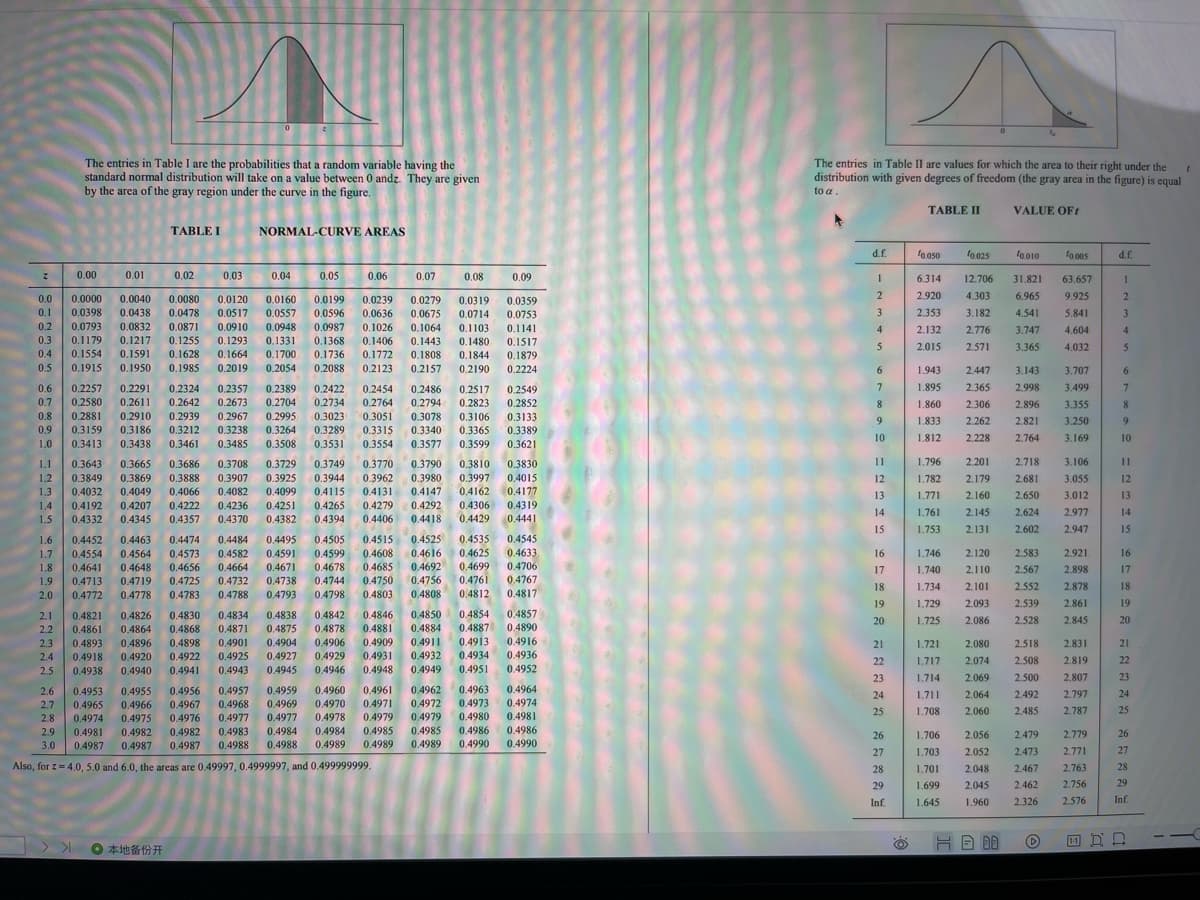
Transcribed Image Text:The entries in Table I are the probabilities that a random variable having the
standard normal distribution will take on a value between 0 andz. They are given
by the area of the gray region under the curve in the figure,
The entries in Table II are values for which the area to their right under the
distribution with given degrees of freedom (the gray area in the figure) is equal
to a .
TABLE II
VALUE OFt
TABLE I
NORMAL-CURVE AREAS
d.f.
fo.025
lo010
fo 005
JP
0.00
0.01
0.02
0.03
0.04
0.05
0.06
0.07
0.08
0.09
1
6.314
12.706
31.821
63.657
0.0
0.0000
0.0040
0.0080
0.0120
0.0160
0.0199
0.0239
0.0279
0.0319
0.0359
2
2.920
4.303
6.965
9.925
2
0.1
0.0398
0.0438
0.0478
0.0517
0.0557
0.0596
0.0636
0.0675
0.0714
0.0753
2.353
3.182
4.541
5.841
3
0.2
0.0793
0.0832
0.0871
0.0910
0.0987
0.0948
0.1331
0.1026
0.1064
0.1103
0.1141
4
2.132
2.776
3.747
4.604
4.
0.1406
0.1772
0.3
0.1179
0.1217
0.1255
0.1293
0.1368
0.1443
0.1480
0.1517
5
2.015
2.571
3.365
4.032
0.1554
0.1915
0.4
0.1591
0.1628
0.1664
0.1700
0.1736
0.1808
0.1844
0.1879
0.5
0.1950
0.1985
0.2019
0.2054
0.2088
0.2123
0.2157
0.2190
0.2224
6.
1.943
2.447
3.143
3.707
6.
7.
0.2291
0.2611
0.6
0.2257
0.2324
0.2357
0.2389
0.2422
0.2454
0.2486
0.2517
0.2549
7
1.895
2.365
2.998
3.499
0.7
0.2580
0.2642
0.2673
0.2704
0.2734
0.2764
0.2794
0.2823
0.2852
0.3133
8.
1.860
2.306
2.896
3.355
8.
0.8
0.2881
0.2910
0.2939
0.2967
0.2995
0.3023
0.3051
0.3078
0.3106
9.
1.833
2.262
2.821
3.250
9.
0.3365
0.3389
0.3599 0.3621
0.9
0.3159
0.3186
0.3212
0.3238
0.3264
0.3289
0.3315
0.3340
10
1.812
2.228
2.764
3.169
10
1.0
0.3413
0.3438
0.3461
0.3485
0.3508
0.3531
0.3554
0.3577
1.1
0.3643
0.3665
0.3686
11
1.796
2.201
2.718
3.106
11
0.3708
0.3907
0.3729
0.3749
0.3770
0.3790
0.3810 0.3830
0.3849
0.4032
1.2
0.3869
0.3888
0.3925
0.3944
0.3962
0.4131
0.3980
0.4147
0.3997
0.4015
0.4162 0.4177
12
1.782
2.179
2.681
3.055
12
1.3
0.4049
0.4066
0.4082
0.4099
0.4115
13
1.771
2.160
2.650
3.012
13
1.4
0.4192
0.4207
0,4222
0.4236
0.4251
0.4265
0.4279
0.4292
0.4306 0.4319
14
1.761
2.145
2,624
2.977
14
1.5
0.4332
0.4345
0.4357
0.4370
0.4382
0.4394
0.4406
0.4418
0.4429
0.4441
15
1.753
2.131
2.602
2.947
15
0.4505
0.4599
1.6
0.4452
0.4463
0.4474
0.4484
0.4495
0.4515
0.4525
0.4535 0.4545
0.4582
0.4591
0.4608
0.4616
2.120
0.4625
0.4699 0.4706
0.4767
1.7
0.4554
0.4564
0.4573
0.4633
16
1.746
2.583
2.921
16
1.8
0.4641
0.4648
0.4656
0.4664
0.4671
0.4678
0.4685
0.4692
17
1.740
2.110
2.567
2.898
17
0.4725
0.4783
0.4732
0.4788
0,4738
0,4793
1.9
0.4713
0.4719
0.4744
0.4750 0.4756
0.4761
18
1.734
2.101
2.552
2.878
18
2.0
0.4772
0.4778
0.4798
0.4803
0.4808
0.4812
0.4817
19
1.729
2.093
2,539
2.861
19
0.4834
0.4871
0.4850
0.4884
0.4854
0.4857
0.4887 0.4890
0.4826
0.4830
0.4838
0.4875
2.1
0.4821
0.4842
0.4846
20
1.725
2.086
2.528
2.845
20
0.4864
0.4896
2.2
0.4861
0.4868
0.4878
0.4881
0.4898
0.4922
0.4909
0.4931
0.4916
0.4893
0.4918
2.3
0.4901
0.4904
0.4906
0.4911
0.4913
21
1.721
2,080
2.518
2.831
21
2.4
0.4920
0.4925
0.4927
0.4929
0.4932
0.4934
0.4936
22
1.717
2.074
2.508
2.819
22
2.5
0.4938
0.4940
0.4941
0.4943
0.4945
0.4946
0.4948
0.4949
0.4951
0.4952
23
1.714
2.069
2.500
2.807
23
0.4956
0.4967
0.4960
0.4970
0.4962
0.4972
0.4959
0.4964
0.4955
0.4966
2.6
0.4953
0.4957
0.4961
0.4963
24
1.711
2.064
2.492
2.797
24
0.4971
0.4973
0.4980
2.7
0.4965
0.4968
0.4969
0.4974
25
1.708
2.060
2.485
2.787
25
2.8
0.4974
0.4975
0.4976
0.4977
0.4977
0.4978
0.4979
0.4979
0.4981
0.4986
0.4990
0.4984
0.4985
0.4986
0.4990
2.9
0.4981
0.4982
0.4982
0.4983
0.4984
0.4985
26
1.706
2.056
2.479
2.779
26
3.0
0.4987
0.4987
0.4987
0.4988
0.4988
0.4989
0.4989
0.4989
27
1.703
2.052
2.473
2.771
27
Also, for z= 4.0, 5.0 and 6.0, the areas are 0.49997, 0.4999997, and 0.499999999.
28
1.701
2.048
2,467
2.763
28
29
1.699
2.045
2.462
2.756
29
Inf.
1.645
1.960
2.326
2.576
Inf.
0本地备份开
Expert Solution
This question has been solved!
Explore an expertly crafted, step-by-step solution for a thorough understanding of key concepts.

This is a popular solution!

Trending now
This is a popular solution!

Step by step
Solved in 2 steps with 3 images

Recommended textbooks for you
Holt Mcdougal Larson Pre-algebra: Student Edition…
Algebra
ISBN:
9780547587776
Author:
HOLT MCDOUGAL
Publisher:
HOLT MCDOUGAL

College Algebra (MindTap Course List)
Algebra
ISBN:
9781305652231
Author:
R. David Gustafson, Jeff Hughes
Publisher:
Cengage Learning

Holt Mcdougal Larson Pre-algebra: Student Edition…
Algebra
ISBN:
9780547587776
Author:
HOLT MCDOUGAL
Publisher:
HOLT MCDOUGAL
College Algebra (MindTap Course List)
Algebra
ISBN:
9781305652231
Author:
R. David Gustafson, Jeff Hughes
Publisher:
Cengage Learning

Algebra & Trigonometry with Analytic Geometry
Algebra
ISBN:
9781133382119
Author:
Swokowski
Publisher:
Cengage