Test if β2 is equal to or greater than three at α = 1%. Interpret the answer.

MATLAB: An Introduction with Applications
6th Edition
ISBN:9781119256830
Author:Amos Gilat
Publisher:Amos Gilat
Chapter1: Starting With Matlab
Section: Chapter Questions
Problem 1P

Related questions
Question
Test if β2 is equal to or greater than three at α = 1%. Interpret the answer.
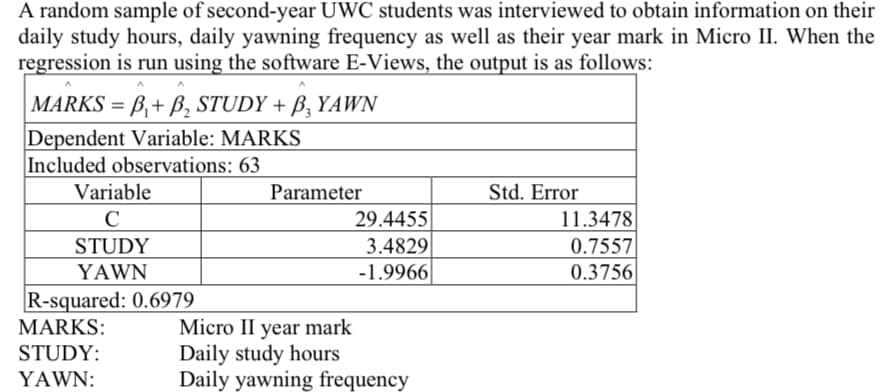
Transcribed Image Text:A random sample of second-year UWC students was interviewed to obtain information on their
daily study hours, daily yawning frequency as well as their year mark in Micro II. When the
regression is run using the software E-Views, the output is as follows:
|MARKS = B₁+ B₂ STUDY + B, YAWN
Dependent Variable: MARKS
Included observations: 63
Variable
C
STUDY
YAWN
R-squared: 0.6979
MARKS:
STUDY:
YAWN:
Parameter
29.4455
3.4829
-1.9966
Micro II year mark
Daily study hours
Daily yawning frequency
Std. Error
11.3478
0.7557
0.3756
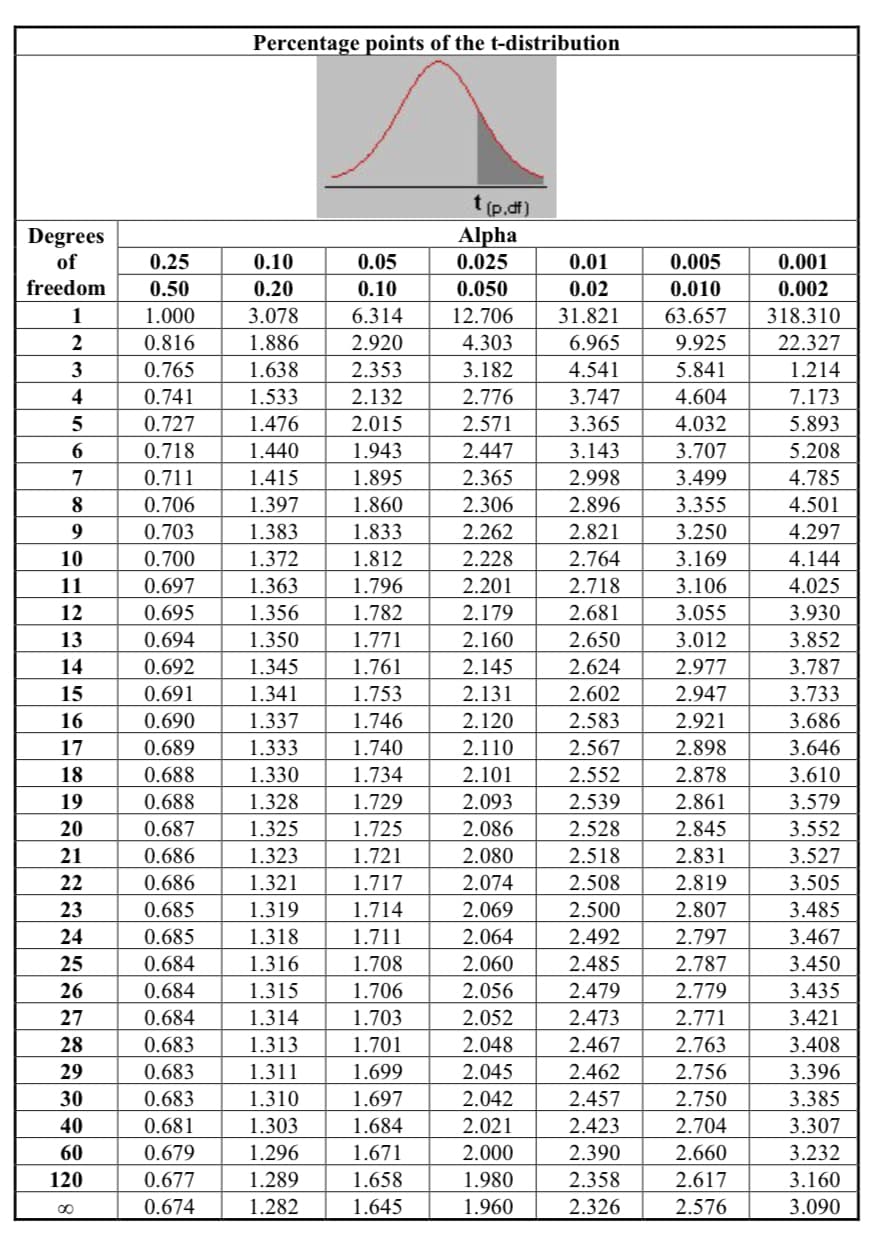
Transcribed Image Text:Degrees
of
0.25
freedom 0.50
1.000
0.816
0.765
0.741
0.727
0.718
0.711
1
2
3
4
5
6
7
KUHESHSHESPANHA482
9
10
11
12
13
14
15
16
17
18
19
20
21
22
23
25
26
27
29
30
40
60
120
00
0.706
0.703
0.700
0.697
0.695
0.694
0.692
0.691
0.690
0.689
0.688
0.688
0.687
0.686
0.686
0.685
0.685
0.684
0.684
0.684
0.683
0.683
0.683
0.681
0.679
0.677
0.674
Percentage points of the t-distribution
0.10
0.20
3.078
1.886
1.638
1.533
1.476
1.440
1.415
1.397
1.383
1.372
1.363
1.356
1.350
1.345
1.341
1.337
1.333
1.330
1.328
1.325
1.323
1.321
1.319
1.318
1.316
1.315
1.314
1.313
1.311
1.310
1.303
1.296
1.289
1.282
0.05
0.10
6.314
2.920
2.353
2.132
2.015
1.943
1.895
1.860
1.833
1.812
1.796
1.782
1.771
1.761
1.753
1.746
1.740
1.734
1.729
1.725
1.721
1.717
1.714
1.711
1.708
1.706
1.703
1.701
1.699
1.697
1.684
1.671
1.658
1.645
t(p.df)
Alpha
0.025
0.01
0.050
0.02
12.706 31.821
4.303
6.965
3.182
4.541
2.776
3.747
2.571
3.365
2.447
3.143
2.365
2.998
2.896
2.821
2.764
2.718
2.681
2.650
2.624
2.602
2.583
2.567
2.552
2.539
2.528
2.518
2.508
2.306
2.262
2.228
2.201
2.179
2.160
2.145
2.131
2.120
2.110
2.101
2.093
2.086
2.080
2.074
2.069
2.064
2.060
2.056
2.052
2.048
2.045
2.042
2.021
2.000
1.980
1.960
2.500
2.492
2.485
2.479
2.473
2.467
2.462
2.457
2.423
2.390
2.358
2.326
0.005
0.010
63.657
9.925
5.841
4.604
4.032
3.707
3.499
3.355
3.250
3.169
3.106
3.055
3.012
2.977
2.947
2.921
2.898
2.878
2.861
2.845
2.831
2.819
2.807
2.797
2.787
2.779
2.771
2.763
2.756
2.750
2.704
2.660
2.617
2.576
0.001
0.002
318.310
22.327
1.214
7.173
5.893
5.208
4.785
4.501
4.297
4.144
4.025
3.930
3.852
3.787
3.733
3.686
3.646
3.610
3.579
3.552
3.527
3.505
3.485
3.467
3.450
3.435
3.421
3.408
3.396
3.385
3.307
3.232
3.160
3.090
Expert Solution
This question has been solved!
Explore an expertly crafted, step-by-step solution for a thorough understanding of key concepts.

Step by step
Solved in 2 steps with 1 images

Recommended textbooks for you
MATLAB: An Introduction with Applications
Statistics
ISBN:
9781119256830
Author:
Amos Gilat
Publisher:
John Wiley & Sons Inc

Probability and Statistics for Engineering and th…
Statistics
ISBN:
9781305251809
Author:
Jay L. Devore
Publisher:
Cengage Learning

Statistics for The Behavioral Sciences (MindTap C…
Statistics
ISBN:
9781305504912
Author:
Frederick J Gravetter, Larry B. Wallnau
Publisher:
Cengage Learning
MATLAB: An Introduction with Applications
Statistics
ISBN:
9781119256830
Author:
Amos Gilat
Publisher:
John Wiley & Sons Inc
Probability and Statistics for Engineering and th…
Statistics
ISBN:
9781305251809
Author:
Jay L. Devore
Publisher:
Cengage Learning
Statistics for The Behavioral Sciences (MindTap C…
Statistics
ISBN:
9781305504912
Author:
Frederick J Gravetter, Larry B. Wallnau
Publisher:
Cengage Learning

Elementary Statistics: Picturing the World (7th E…
Statistics
ISBN:
9780134683416
Author:
Ron Larson, Betsy Farber
Publisher:
PEARSON

The Basic Practice of Statistics
Statistics
ISBN:
9781319042578
Author:
David S. Moore, William I. Notz, Michael A. Fligner
Publisher:
W. H. Freeman

Introduction to the Practice of Statistics
Statistics
ISBN:
9781319013387
Author:
David S. Moore, George P. McCabe, Bruce A. Craig
Publisher:
W. H. Freeman