Test if significant difference on the beginning and current salary among the minority.
Test if significant difference on the beginning and current salary among the minority.

MATLAB: An Introduction with Applications
6th Edition
ISBN:9781119256830
Author:Amos Gilat
Publisher:Amos Gilat
Chapter1: Starting With Matlab
Section: Chapter Questions
Problem 1P

Related questions
Question
Test if significant difference on the beginning and current salary among the minority.
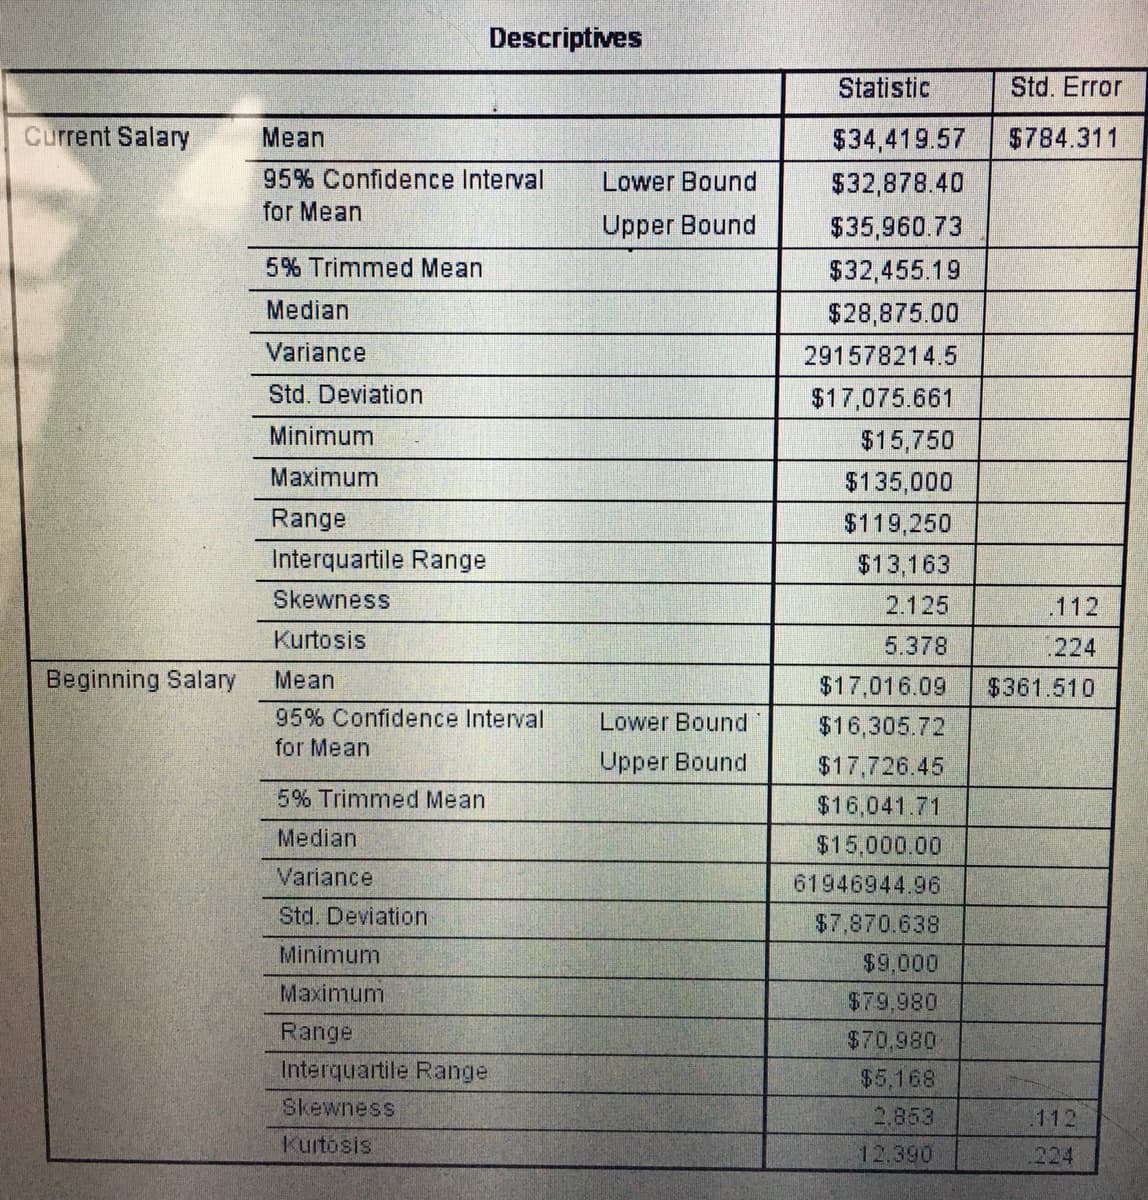
Transcribed Image Text:Descriptives
Statistic
Std. Error
Current Salary
Mean
$34,419.57
$784.311
95% Confidence Interval
Lower Bound
$32,878.40
for Mean
Upper Bound
$35,960.73
5% Trimmed Mean
$32,455.19
Median
$28,875.00
Variance
291578214.5
Std. Deviation
$17,075.661
Minimum
$15,750
Maximum
$135,000
Range
$119,250
Interquartile Range
$13,163
Skewness
2.125
.112
Kurtosis
5.378
.224
Beginning Salary
Mean
$17,016.09
$361.510
95% Confidence Interval
for Mean
Lower Bound
$16,305.72
Upper Bound
$17,726.45
5% Trimmed Mean
$16,041.71
Median
$15,000.00
Variance
61946944.96
Std. Deviation
$7,870.638
Minimum
$9,000
Мaximum
$79,980
Range
$70,980
Interquartile Range
$5,168
Skewness
2,853
.112
Kurtosis
12.390
224
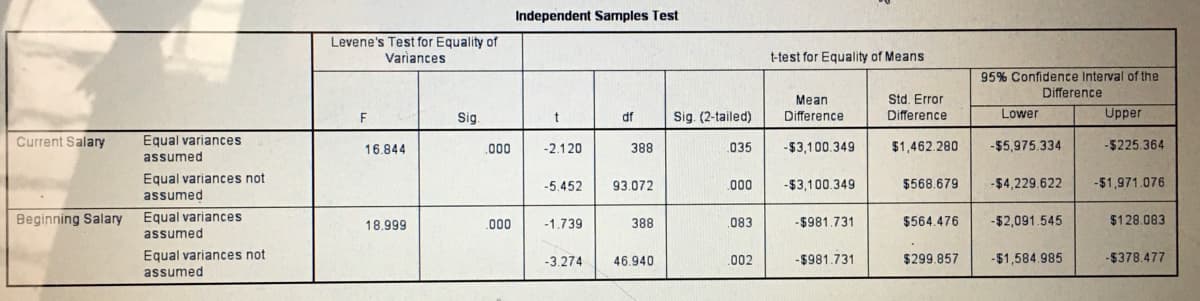
Transcribed Image Text:Independent Samples Test
Levene's Test for Equality of
Variances
t-test for Equality of Means
95% Confidence Interval of the
Difference
Mean
Std. Error
Sig.
Sig. (2-tailed)
Difference
Difference
Lower
Upper
df
Current Salary
Equal variances
.000
-2.120
035
-$3,100.349
$1,462.280
-$5,975.334
-$225.364
16.844
388
assumed
Equal variances not
93.072
-$3,100.349
$568.679
-$4,229.622
-$1,971.076
-5.452
00
assumed
Beginning Salary
Equal variances
.000
-1.739
388
.083
-$981.731
$564.476
-$2,091.545
$128.083
18.999
assumed
Equal variances not
assumed
-3.274
46.940
002
-$981.731
$299.857
-%$1,584.985
-$378.477
Expert Solution
This question has been solved!
Explore an expertly crafted, step-by-step solution for a thorough understanding of key concepts.

Step by step
Solved in 2 steps

Recommended textbooks for you
MATLAB: An Introduction with Applications
Statistics
ISBN:
9781119256830
Author:
Amos Gilat
Publisher:
John Wiley & Sons Inc

Probability and Statistics for Engineering and th…
Statistics
ISBN:
9781305251809
Author:
Jay L. Devore
Publisher:
Cengage Learning

Statistics for The Behavioral Sciences (MindTap C…
Statistics
ISBN:
9781305504912
Author:
Frederick J Gravetter, Larry B. Wallnau
Publisher:
Cengage Learning
MATLAB: An Introduction with Applications
Statistics
ISBN:
9781119256830
Author:
Amos Gilat
Publisher:
John Wiley & Sons Inc
Probability and Statistics for Engineering and th…
Statistics
ISBN:
9781305251809
Author:
Jay L. Devore
Publisher:
Cengage Learning
Statistics for The Behavioral Sciences (MindTap C…
Statistics
ISBN:
9781305504912
Author:
Frederick J Gravetter, Larry B. Wallnau
Publisher:
Cengage Learning

Elementary Statistics: Picturing the World (7th E…
Statistics
ISBN:
9780134683416
Author:
Ron Larson, Betsy Farber
Publisher:
PEARSON

The Basic Practice of Statistics
Statistics
ISBN:
9781319042578
Author:
David S. Moore, William I. Notz, Michael A. Fligner
Publisher:
W. H. Freeman

Introduction to the Practice of Statistics
Statistics
ISBN:
9781319013387
Author:
David S. Moore, George P. McCabe, Bruce A. Craig
Publisher:
W. H. Freeman