Test the claim that on average, heights (in feet) of oak trees in a forest are less than heights of pine trees. Use a = 0.01. It is known that tree heights follow a normal distribution, and the population standard deviation for both species is known to be 10.3 feet. The table below shows the results of two random samples. Туре Oaks 21 56.7 Pines 17 60.7
Test the claim that on average, heights (in feet) of oak trees in a forest are less than heights of pine trees. Use a = 0.01. It is known that tree heights follow a normal distribution, and the population standard deviation for both species is known to be 10.3 feet. The table below shows the results of two random samples. Туре Oaks 21 56.7 Pines 17 60.7

MATLAB: An Introduction with Applications
6th Edition
ISBN:9781119256830
Author:Amos Gilat
Publisher:Amos Gilat
Chapter1: Starting With Matlab
Section: Chapter Questions
Problem 1P

Related questions

Question
100%

Transcribed Image Text:Translate
sde
OZ since testing two proportions
OT since both o values are not known
The Degrees of Freedom (use the simple estimate discussed in the notes, not the messy formula) are
ON/A; this is a Z-test
O 16
O21
3. The STS (round to 3 decimals) is:
The P-value (round to 4 decimals) is:
4. The decision at a = 0.01 is:
O Do not reject Ho since P > a
O Do not reject Ho since P < a
O Reject Ho since P < a
O Reject Ho since P > a
The conclusion is:
O There is sufficient evidence to conclude that on average, oak tree heights are less than pine tree
heights
O There is insufficient evidence to conclude that on average, oak tree heights are not less than pine
tree heights
O There is insufficient evidence to conclude that on average, oak tree heights are less than pine tree
heights
O There is sufficient evidence to conclude that on average, oak tree heights are not less than pine tree
beights
13
MacBook Air
esc
FI
F4
411
%23
24
2
3
5
6
8.
Q
tab
RI
A
S
ock
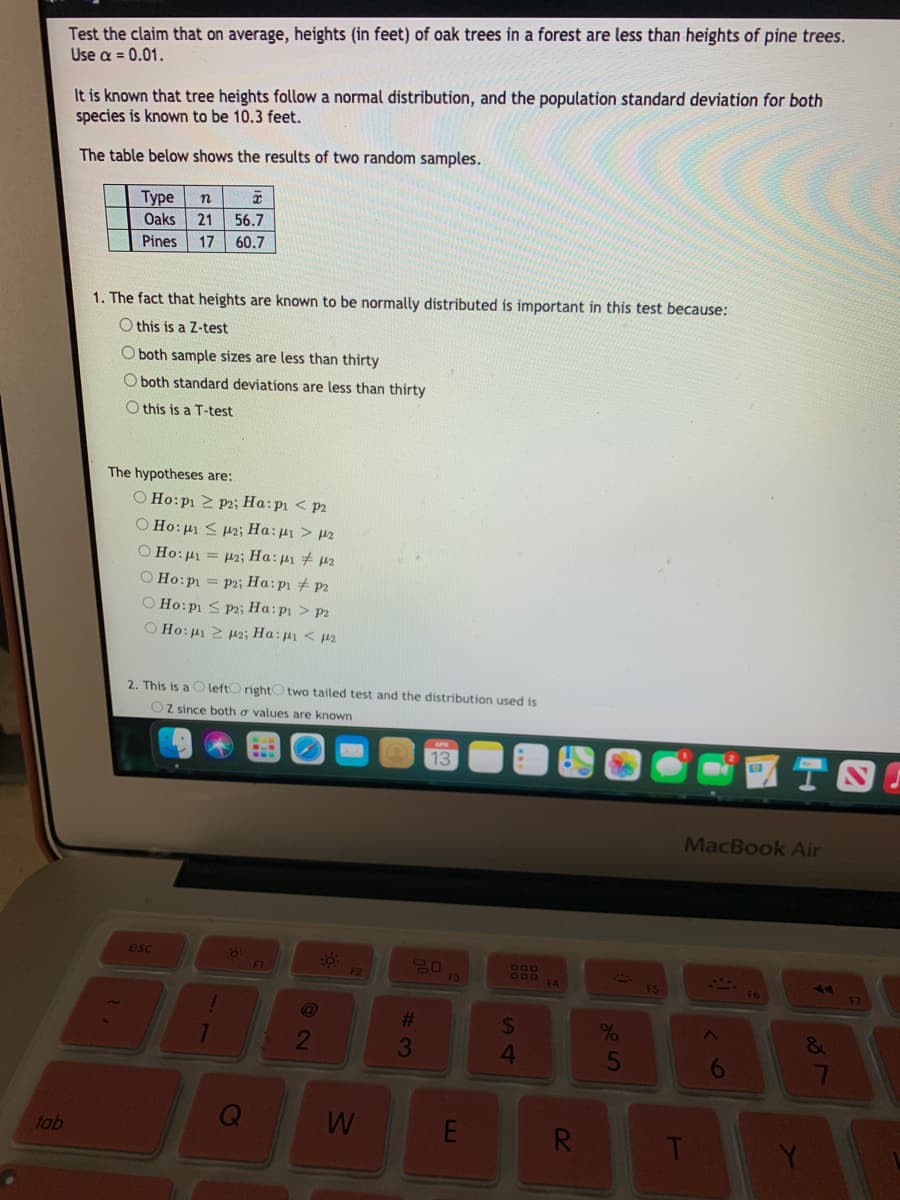
Transcribed Image Text:Test the claim that on average, heights (in feet) of oak trees in a forest are less than heights of pine trees.
Use a = 0.01.
It is known that tree heights follow a normal distribution, and the population standard deviation for both
species is known to be 10.3 feet.
The table below shows the results of two random samples.
Туре
21
n
Oaks
56.7
Pines
17
60.7
1. The fact that heights are known to be normally distributed is important in this test because:
O this is a Z-test
O both sample sizes are less than thirty
O both standard deviations are less than thirty
O this is a T-test
The hypotheses are:
O Ho:p1 2 P2; Ha:p1 < P2
O Ho:µ1 < p2; Ha: µ1 > µ2
O Ho:µ1 = µ2; Ha: µ1 + p2
O Ho:p = P2; Ha:p1 # P2
O Ho:pi < P2; Ha: p1 > p2
O Ho:µ1 2 H2; Ha:p < p2
2. This is a O leftO rightO two tailed test and the distribution used is
Oz since both o values are known
13
MacBook Air
esc
F1
80
F3
F2
F4
FS
F6
%23
&
2
3
5
6
tab
R.
Expert Solution
This question has been solved!
Explore an expertly crafted, step-by-step solution for a thorough understanding of key concepts.

Step by step
Solved in 5 steps with 2 images

Knowledge Booster


Learn more about
Need a deep-dive on the concept behind this application? Look no further. Learn more about this topic, statistics and related others by exploring similar questions and additional content below.Recommended textbooks for you
MATLAB: An Introduction with Applications
Statistics
ISBN:
9781119256830
Author:
Amos Gilat
Publisher:
John Wiley & Sons Inc

Probability and Statistics for Engineering and th…
Statistics
ISBN:
9781305251809
Author:
Jay L. Devore
Publisher:
Cengage Learning

Statistics for The Behavioral Sciences (MindTap C…
Statistics
ISBN:
9781305504912
Author:
Frederick J Gravetter, Larry B. Wallnau
Publisher:
Cengage Learning
MATLAB: An Introduction with Applications
Statistics
ISBN:
9781119256830
Author:
Amos Gilat
Publisher:
John Wiley & Sons Inc
Probability and Statistics for Engineering and th…
Statistics
ISBN:
9781305251809
Author:
Jay L. Devore
Publisher:
Cengage Learning
Statistics for The Behavioral Sciences (MindTap C…
Statistics
ISBN:
9781305504912
Author:
Frederick J Gravetter, Larry B. Wallnau
Publisher:
Cengage Learning

Elementary Statistics: Picturing the World (7th E…
Statistics
ISBN:
9780134683416
Author:
Ron Larson, Betsy Farber
Publisher:
PEARSON

The Basic Practice of Statistics
Statistics
ISBN:
9781319042578
Author:
David S. Moore, William I. Notz, Michael A. Fligner
Publisher:
W. H. Freeman

Introduction to the Practice of Statistics
Statistics
ISBN:
9781319013387
Author:
David S. Moore, George P. McCabe, Bruce A. Craig
Publisher:
W. H. Freeman