Test the claim that the proportion of men who own cats is significantly different than the proportion of women who own cats at the 0.2 significance level.
Test the claim that the proportion of men who own cats is significantly different than the proportion of women who own cats at the 0.2 significance level.

Holt Mcdougal Larson Pre-algebra: Student Edition 2012
1st Edition
ISBN:9780547587776
Author:HOLT MCDOUGAL
Publisher:HOLT MCDOUGAL
Chapter11: Data Analysis And Probability
Section: Chapter Questions
Problem 8CR

Related questions

Topic Video
Question
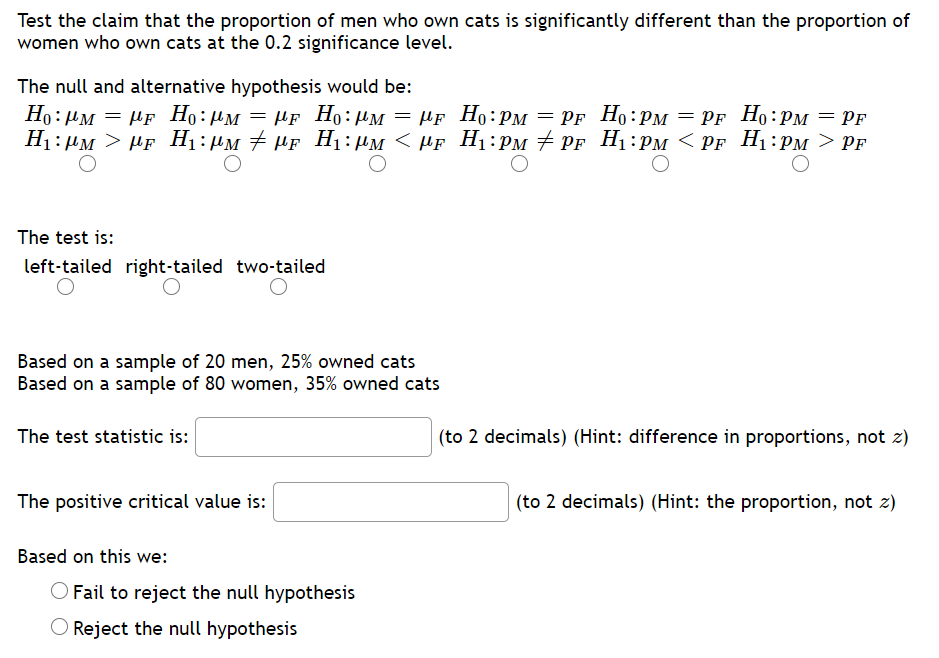
Transcribed Image Text:Test the claim that the proportion of men who own cats is significantly different than the proportion of
women who own cats at the 0.2 significance level.
The null and alternative hypothesis would be:
Но : им — ИF Ho: Им — Иr Но: им — Ar Ho: Pм — Pr Ho:Pм — Pr Ho:рм — Pғ
µf Ho:PM
PF Ho:PM = PF Ho:PM
H1: µM > µF H1:µM + HF H1:µM < µF H1:PM + PF H1:PM < PF H1:PM > PF
The test is:
left-tailed right-tailed two-tailed
Based on a sample of 20 men, 25% owned cats
Based on a sample of 80 women, 35% owned cats
The test statistic is:
(to 2 decimals) (Hint: difference in proportions, not z)
The positive critical value is:
(to 2 decimals) (Hint: the proportion, not z)
Based on this we:
O Fail to reject the null hypothesis
O Reject the null hypothesis
Expert Solution
This question has been solved!
Explore an expertly crafted, step-by-step solution for a thorough understanding of key concepts.

This is a popular solution!

Trending now
This is a popular solution!

Step by step
Solved in 2 steps

Knowledge Booster


Learn more about
Need a deep-dive on the concept behind this application? Look no further. Learn more about this topic, statistics and related others by exploring similar questions and additional content below.Recommended textbooks for you
Holt Mcdougal Larson Pre-algebra: Student Edition…
Algebra
ISBN:
9780547587776
Author:
HOLT MCDOUGAL
Publisher:
HOLT MCDOUGAL
Holt Mcdougal Larson Pre-algebra: Student Edition…
Algebra
ISBN:
9780547587776
Author:
HOLT MCDOUGAL
Publisher:
HOLT MCDOUGAL