Test the claim that the mean GPA of Orange Coast students is larger than the mean GPA of Coastline students at the 0.05 significance level.
Q: Your claim results in the following alternative hypothesis: Ha : μ << 168 which you test at a…
A: Given data Ha:μ<168 α=.001 we have to find critical value = ?
Q: calculate the mean squared between treatments value for a repeated measures ANOVA with 26…
A: Introduction: It is required to calculate the mean squared between treatments value in case of a…
Q: A survey states that the names a the local city office to help imprc surveying is not being followed…
A: There are some basic principle which we follow for proper surveying. A. Ethics in Surveys…
Q: leading magazine (like Barron's) reported at one time that the average number of weeks an individual…
A: Given data μ=24.6 σ=4.3 n = 71
Q: "If an ANOVA had 16 observations in each condition, calculate the value of SS-within treatments…
A: From given data we have : T1=34.43, T2=31.55, T3=35.66, n=16
Q: Independent continuous random variables with the following: if 0≤x otherwise fx(x) = = {** 0 2y fr…
A: Consider X and Y to be two continuous independent random variables with pdf fXx and fYy,…
Q: 1,000 800 600 400 200 0 Sales of Sony Blu-Ray Disc Players at Bob's Appliance Mart (a) What kind of…
A: The given graph is a column chart with pictures for columns. Here, the size of the CD gives an…
Q: For a study conducted by the research department of a pharmaceutical company, 245 randomly selected…
A: Given n1=245, x̄1=17.8, s1=4.3 n2=225, x̄2=18.2, s2=3.6
Q: An experiment was conducted to estimate the effect of smoking on the blood pressure of a group of 31…
A: The sample size is 31, sample mean is 9.1 and sample standard deviation is 5.3.
Q: Both before and after a recent earthquake, surveys were conducted asking voters which of the three…
A: Given data: Peter Alan Sui Before 2077 1751 571 After 1689 1433 464
Q: You are conducting a test of the claim that the row variable and the column variable are dependent…
A: For the given data We have to calculate expected frequency Chi-square statistics Critical value…
Q: A company wishes to conduct a survey in the shortest length of time possible but still get a high…
A: Ans=a ) telephone survey Shorter survey were reliable and produced higher response and completion…
Q: Construct the confidence interval for the population mean μ. c=0.95, x=4.8, a=0.6, and n=55 A 95%…
A: Given Mean = 4.8 Sd = 0.6 N = 55
Q: Tables, Charts and Diagrams The coffee preferences of 100 people were recorded in a survey.…
A: The pie chart is given Total 100 peoples were recorded in a survey.
Q: The following is a set of data for a population with N = 10. 15 2 1 3 10 9 9 10 9 8 a. Compute the…
A: We have given that, 15, 2, 1, 3, 10, 9, 9, 10, 9, 8 Then, We will find the population mean and…
Q: our claim results in the following alternative hypothesis: Ha : μ < 152, which you test at a…
A: given data ,hypothesis :H0: μ =152H1: μ <152α=0.001 critical value =?
Q: Use the given degree of confidence and sample data to construct a confidence interval for the…
A: Given that n = 319 , X = 120 99% confidence interval
Q: 8. The average effect size in social psychology is around d = 0.21. Conventionally, a sample over 30…
A: Power is the chance of rejecting the null hypothesis when it is false. It is calculated by…
Q: You intend to estimate a population mean with a confidence interval. You believe the population to…
A:
Q: On a planet far far away from Earth, IQ of the ruling species is normally distributed with a mean of…
A: For the distribution of the IQ scores of individuals, it is interpreted that: μ (mean)=107, σ…
Q: Find the range, variance, and standard deviation for the given sample data, if possible. If the…
A: x x2 1 1 2 4 2 4 2 4 3 9 2 4 4 16 2 4 2 4 2 4 2 4 3 9 1 1 2 4 2 4 2…
Q: Chauncey Billups, a current shooting guard for the Los Angeles Clippers, has a career free-throw…
A: given data Chauncey Billups , acirrent shooting guard for the Los Angeles Cliipers,has a carrer…
Q: You intend to conduct a goodness-of-fit test for a multinomial distribution with 8 categories. You…
A: conduct a goodness-of-fit test for a multinomial distribution with 8 categories. So no. Of…
Q: Problem 4 In a poker game, Melanie has a very strong hand and bets $5. The probability that Ben has…
A: The probability of Ben has better hand is 0.04 Ben has a better hand he would raise with probability…
Q: You are conducting a test of the claim that the row variable and the column variable are dependent…
A: Given Observe frequency: O1=42, O2=22, O3=5, O4=41, O5=31, O6=15 Expected frequency: E1=36.71,…
Q: A professor who teaches a large introductory statistics class (197 students) with eight discussion…
A: a) Null Hypothesis: H0: All 8 groups have same mean. Alternative Hypothesis: H1: At least one group…
Q: One weakness of a systematic sample is that Select one: a. It is difficult to separate the…
A: Systematic Sampling Technique: The systematic sampling technique is a type of random sampling method…
Q: The following is a set of data for a population with N = 10. 15 2 1 3 10 9 9 10 9 8 a. Compute the…
A: Data given 15,2,1,3,10,9,9,10,9,8
Q: TON 44 "A clinical psychologist wants to compare the efficacy of medication versus Cognitive…
A:
Q: Do male and female college students have the same distribution of living arrangements? Use a level…
A: The question is about categorical data analysis Given : Level of signif. ( α ) = 0.05 To find :…
Q: A regression was run to determine if there is a relationship between hours of TV watched per day (x)…
A: given data here, x=no of hour tv watched per day. y=number of Situps a person Can do. a=-1.13…
Q: You wish to test the following claim (H₁) at a significance level of a = 0.001. H₂:₁ = ₂ Ha: <H₂ You…
A: Given: H0:μ1=μ2 Ha:μ1<μ2 (claim) Required: To test the claim at a significance level α=0.001
Q: The following is a set of data for a population with N = 10. 15 2 1 3 10 9 9 10 9 8 a. Compute the…
A: Given data 15,2,1,3,10,9,9,10,9,8
Q: You wish to test the following claim (HaHa) at a significance level of α=0.005α=0.005. a)…
A: given data,α = 0.005Ho : P1 =P2Ha :P1 <P2n1 = 404x1 = 222p1^ =222404 = 0.5495n2 = 623x2 =…
Q: 2. a) b) The following data shows the average length of new discovered species of worms code named…
A: Histogram is the graph used to plot the continuous frequency data. It helps to understand the shape…
Q: Question: If two events, A and B, are independent, which of the following statements is true? A:…
A: Given;We have two events A and B. both events A and B are indepedent.
Q: Two samples are taken with the following numbers of successes and sample sizes r1 = 20; r2 = 38 n1 =…
A: given data n1=64n2=51r1 = 20r2 = 38confidence interval = 0.97α =…
Q: Suppose the newspaper states that the probability of rain today is 40%. What is the complement of…
A: given data probability of rain today = 40% in symbol : p(rain today) = 0.40
Q: Draw a frequency polygon for the following: 2.5 7.5 3 5 Mid-Value of Class Interval: Frequency: 12.5…
A:
Q: Suppose that the heights of adult men in the United States are normally distributed with a mean of…
A: GivenMean(μ)=69.5 inchesstandard deviation(σ)=3.5 inches
Q: Use the F-scale measurements of tornadoes listed in the accompanying table. The range of the data…
A: The question is about signif. of actual std. deviation Given : Range of the given data = 4 Actual…
Q: Question 11 At a drug rehab center 37% experience depression and 30% experience weight gain. 13%…
A: given data event A : experience depression event B : experience weight gain P(A) = 0.37 P(B) =…
Q: The following three independent random samples are obtained from three normally distributed…
A: Given data: Group1: Internship Group2: Co-op Group3: Work study 11.5 9.25 17.5 10.75 14.5…
Q: A 1 total_cases_per_million 2 3 Mean 4 Standard Error 5 Median 6 Mode 7 Standard Deviation B C…
A: Given the two variables: Total cases per million and total deaths
Q: Find the regression equation, letting the first variable be the predictor (x) variable. Using the…
A: The question is about regression Given : To find : 1 ) Reg. eq. 2 ) pred. age best actor given…
Q: QUESTION 27 A repeated measures ANOVA produced the partially completed ANOVA summary table below.…
A: Given that In ANOVA dfbetween = 3 , dfwithin = 20 , dfbetween subject = 5 , dferror = 4 SSbetween =…
Q: A portfolio is comprised of two stocks A, and B. The position in stock A is valued at w (in £m) and…
A:
Q: Which of the following correctly describes the nature of discrete quantitative variables? a. They…
A: The objective is to identify the statement that correctly describes the nature of discrete…
Q: B/ Let the distribution function c.d.f of X is 0 0.8 Find the PMF of X. F(x) = 0.9 0.98 x < 0 0≤x≤1…
A:
Q: Rail ridership during the summer months in the North-East is believed to be closely related to the…
A: Given data: Tourists Rail Ridership 9 2.3 4 1.9 7 1.7 5 1.8 12 2.8 13 2.9 14 2.4…
Can't get the correct test statistic :,(
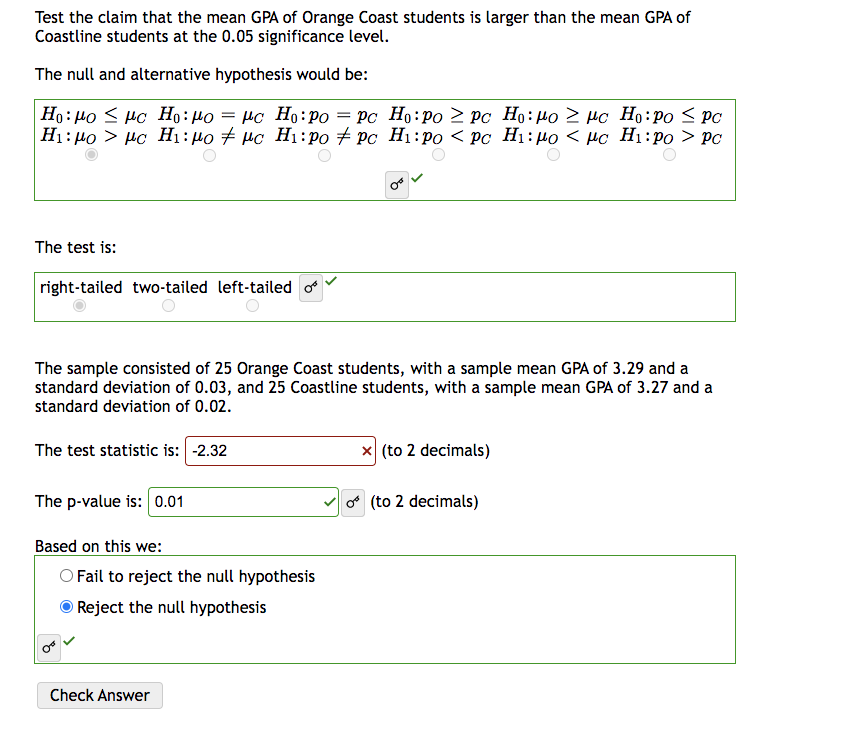
Step by step
Solved in 6 steps