Test the hypothesis as to whether or not the cases of fatal accidents are related to the sizes of vehicles as perceived by respondents. Use a =1% Responses Small (Cars/ Motors) Medium Large (Heavy, Cargo Trucks) Cases (Buses) Fatal 300 150 50 Not Fatal 100 40 90 TEST OF HYPOTHESIS IN ENUMERATION DATA ANALYSIS 20
Test the hypothesis as to whether or not the cases of fatal accidents are related to the sizes of vehicles as perceived by respondents. Use a =1% Responses Small (Cars/ Motors) Medium Large (Heavy, Cargo Trucks) Cases (Buses) Fatal 300 150 50 Not Fatal 100 40 90 TEST OF HYPOTHESIS IN ENUMERATION DATA ANALYSIS 20

MATLAB: An Introduction with Applications
6th Edition
ISBN:9781119256830
Author:Amos Gilat
Publisher:Amos Gilat
Chapter1: Starting With Matlab
Section: Chapter Questions
Problem 1P

Related questions
Question
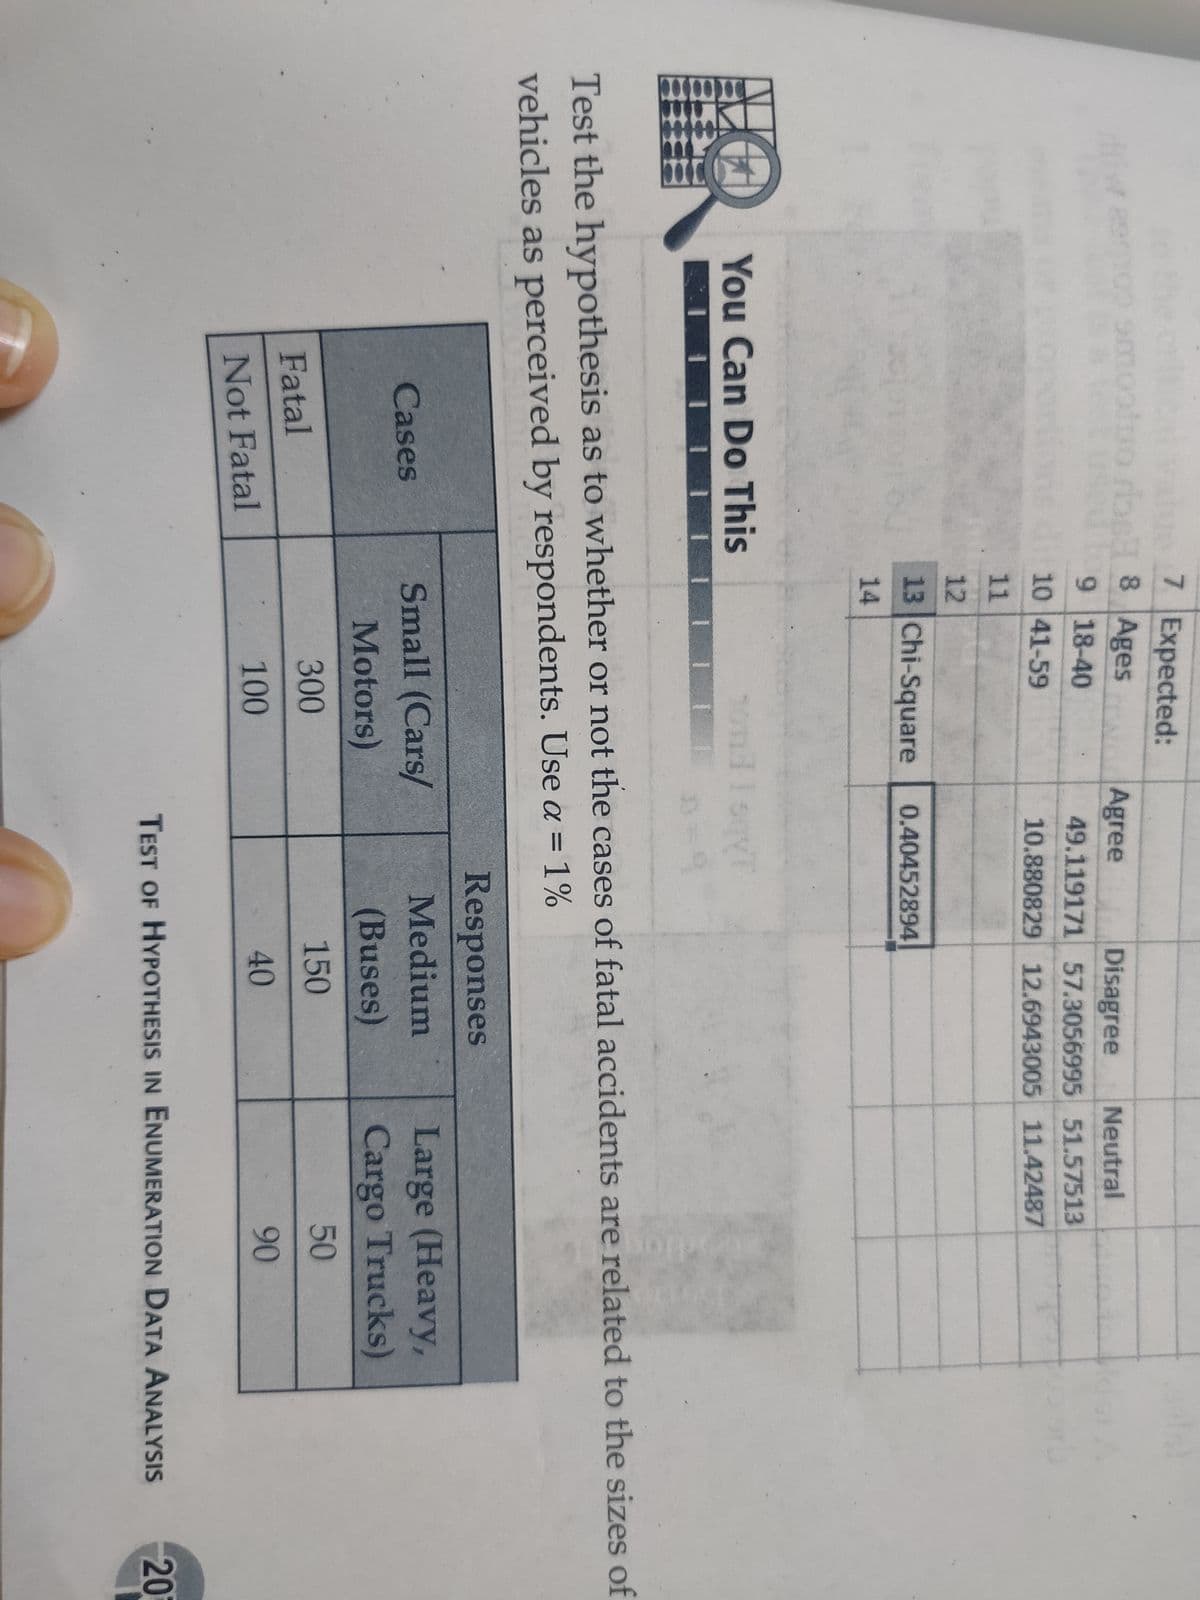
Transcribed Image Text:7 Expected:
bel8 Ages
Agree
Disagree
Neutral
9 18-40
49.119171 57.3056995 51.57513
10 41-59
10.880829 12.6943005 11.42487
11
12
13 Chi-Square
0.40452894
14
You Can Do This
hond I sqy
II II
Test the hypothesis as to whether or not the cases of fatal accidents are related to the sizes of
vehicles as perceived by respondents. Use a = 1%
Responses
Large (Heavy,
Cargo Trucks)
Medium
Small (Cars/
Motors)
Cases
(Buses)
300
150
50
Fatal
100
40
90
Not Fatal
TEST OF HYPOTHESIS IN ENUMERATION DATA ANALYSIS
20
Expert Solution
This question has been solved!
Explore an expertly crafted, step-by-step solution for a thorough understanding of key concepts.

This is a popular solution!

Trending now
This is a popular solution!

Step by step
Solved in 2 steps

Knowledge Booster


Learn more about
Need a deep-dive on the concept behind this application? Look no further. Learn more about this topic, statistics and related others by exploring similar questions and additional content below.Recommended textbooks for you
MATLAB: An Introduction with Applications
Statistics
ISBN:
9781119256830
Author:
Amos Gilat
Publisher:
John Wiley & Sons Inc

Probability and Statistics for Engineering and th…
Statistics
ISBN:
9781305251809
Author:
Jay L. Devore
Publisher:
Cengage Learning

Statistics for The Behavioral Sciences (MindTap C…
Statistics
ISBN:
9781305504912
Author:
Frederick J Gravetter, Larry B. Wallnau
Publisher:
Cengage Learning
MATLAB: An Introduction with Applications
Statistics
ISBN:
9781119256830
Author:
Amos Gilat
Publisher:
John Wiley & Sons Inc
Probability and Statistics for Engineering and th…
Statistics
ISBN:
9781305251809
Author:
Jay L. Devore
Publisher:
Cengage Learning
Statistics for The Behavioral Sciences (MindTap C…
Statistics
ISBN:
9781305504912
Author:
Frederick J Gravetter, Larry B. Wallnau
Publisher:
Cengage Learning

Elementary Statistics: Picturing the World (7th E…
Statistics
ISBN:
9780134683416
Author:
Ron Larson, Betsy Farber
Publisher:
PEARSON

The Basic Practice of Statistics
Statistics
ISBN:
9781319042578
Author:
David S. Moore, William I. Notz, Michael A. Fligner
Publisher:
W. H. Freeman

Introduction to the Practice of Statistics
Statistics
ISBN:
9781319013387
Author:
David S. Moore, George P. McCabe, Bruce A. Craig
Publisher:
W. H. Freeman