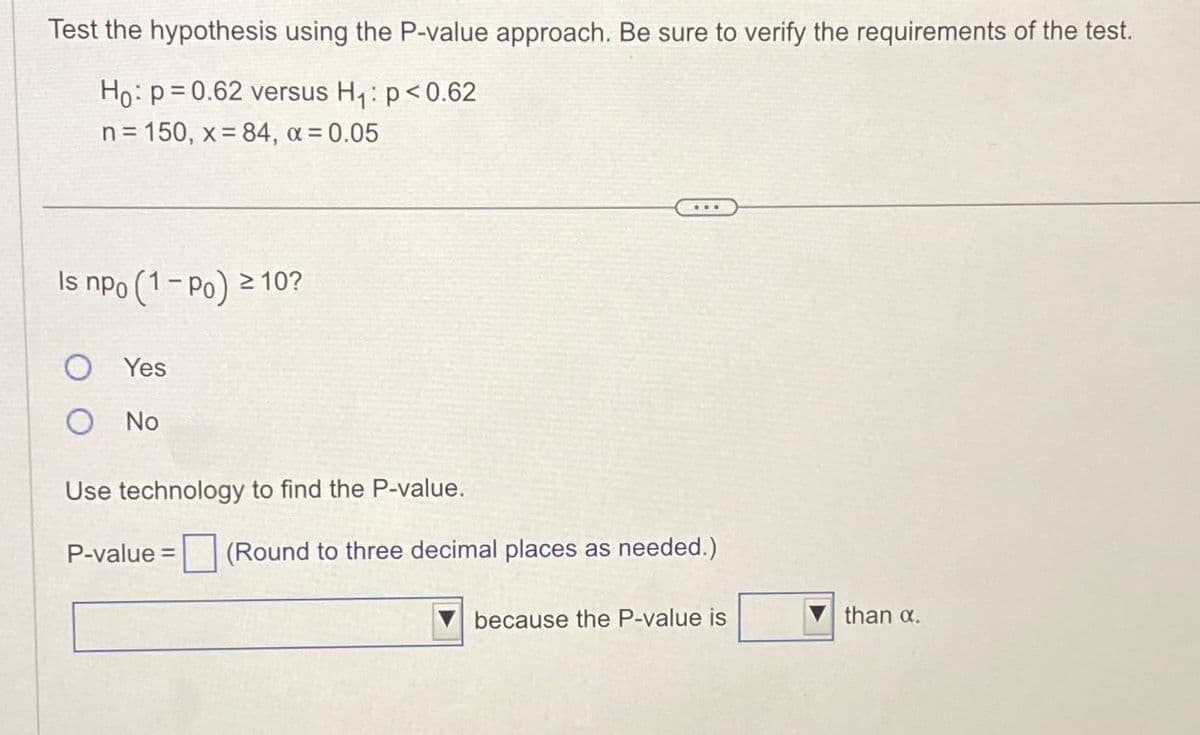
Test the hypothesis using the P-value approach. Be sure to verify the requirements of the test. Ho: p=0.62 versus H₁: p<0.62 n=150, x = 84, α = 0.05 Is npo (1-Po) ≥ 10? OYes No ... Use technology to find the P-value. P-value = (Round to three decimal places as needed.) because the P-value is than α.


Q: Survey question How many of your grandfather is still alive? ascending order…
A: The provided information is as follows:The data set is given as 0000000000011111111222233444The…
Q: Limitless-Food steamer has a mean time before failure of 36 months with a standard deviation of 6…
A: From the provided information,
Q: A car-rental company is interested in the amount of time its vehicles are out of operation for…
A: It is assumed that µ is the population mean number of days in a year that all vehicles in the…
Q: Let urban residents correspond to population 1, let suburban residents correspond to population 2,…
A: It is given that Sample size, n1 = 125Favourable cases, x1 = 77Sample size, n2 = 100Favourable…
Q: 15. Let X and Y be continuous random variables with joint density function 24xy for x>0, y>0,…
A: The joint density function for and is
Q: describe the process of simulation of branching process with offspring p0 = 0.1, pl = 0.4, p2 = 0.5…
A: Given,
Q: calculate the geometric mean of the annual hpr and hpy 11-Mar-2020 142.28 144.54 10-Mar-2020 142.48…
A: Given the close price and open price data for the period 31-May-2019 to 11-Mar-2020.
Q: In a test of hypothesis, the null hypothesis is that the population mean is less than or equal to 32…
A: The null and alternative hypothesis for the test is given as:where, denotes the population mean.The…
Q: malls were the exclusive focus of 10 percent of articles. The standard error of that proportion is 3…
A: From the provided information,Confidence level = 95%
Q: Pearson's r is the technical term for the correlation coefficient most often used in psychological…
A: The question is asking whether Pearson's r is the technical term for the correlation coefficient…
Q: Perform Linear Regression Analysis for all three tabs: a. Ln Safety Belt Rate Fatalities Ln Safety…
A: A regression model shows a relationship b/w a dependent variable and one or more independent…
Q: 3. Major League Baseball officials have been concerned about the lengths of games, particularly…
A: The provided information is as follows:The sample 1 represents the playoff.Sample 2 represents the…
Q: The summary statistics for a certain set of points are: = 132.96, and b₁ = 2.91. n = 25, s=2.76, Σ…
A: n=25want to construct a 98% confidence interval for .want to find a degree of freedom of critical…
Q: 4.1-4. Select an (even) integer randomly from the set {0, 2, 4, 6, 8). Then select an integer…
A: Given Sets are:Set 1={0,2,4,6,8}Set 2={0,1,2,3,4}(a) X is the integer that is randomly selected…
Q: We are interested in comparing the average supermarket prices of two leading colas in the Tampa…
A: d¯=−0.0375,Sd=0.0381, n=8=sample size
Q: Compute the reliability of a system with 10 components needing at least 6 in full operation with the…
A: There are 10 components.At least 6 components are in full operation.The objective is to compute the…
Q: In a sample of 183 male job-holders, 55% said that they are satisfied with their jobs. In another…
A: Sample data for the females is given as:Number of females in the sample: Sample proportion of…
Q: Does the scatter diagram indicate any influential observations? -Select your answer - V b. Compute…
A: The data is given on for .xiyi4125147168151018122012242219To determine the scatter plot,…
Q: Suppose we played roulette x5 times (where x = 3 is the last digit of your student ID) and each time…
A: Suppose we played roulette 35 times and each time we bet on the number 17. In each game, the…
Q: A bicycle safety organization claims that fatal bicycle accidents are uniformly distributed…
A: A bicycle safety organization claims that fatal bicycle accidents are uniformly distributed…
Q: 6.13 Public option, Part I: A Washington Post article from 2009 reported that "support for a…
A: The sampled number of people, who are independent, n=783.The sample proportion of the independent…
Q: What does it mean to say two variables are positively associated? When the value of one variable…
A: The objective of the question is to understand the meaning of positive association between two…
Q: tatistics Canada reports that of people who usually work full-time, the average number of hours…
A:
Q: A survey asked, "Do you think that homeless people are responsible for the situation they are in?"…
A: Since you have posted a question with multiple sub-parts, we will solve first three subparts for…
Q: A certain Probability & Statistics instructor assigns letter grades on tests using the following…
A: Given that,Mean() = 77.4Standard deviations () = 7.9
Q: 6. Why are some intervention approaches not amenable to study with a crossover design? 7. What does…
A: We are asked the explain-Why are some intervention approaches not amenable to study with a crossover…
Q: A researcher has developed a regression model from fourteen pairs of data points. He wants to test…
A: Sample size (n)=14Level of significance α=0.01For two tailed test Find t critical value
Q: The following data is to be used to construct a regression model: X 5 7 4 15 12 9 Y 8 9 12 26 16 13…
A: XY587941215261216913
Q: 1. For Marijuana Stigmatization regression equation in Table 3, a. Write the research question being…
A: The regression model is the method used to predict the value of one variable by the other…
Q: Test the claim about the population mean, µ, at the given level of significance using the given…
A: Suppose μ is the population mean.
Q: Test the claim about the population mean, µ, at the given level of significance using the given…
A: The specified claim is that, the population mean, μ=50.The significance level, α=0.05.The population…
Q: In a poll conducted by the general social survey, 70% of respondents said that their jobs were…
A: Probability of respondents said that their jobs were sometimes or always stressful(p)= 0.70sample…
Q: Listed below are paired data consisting of waist size in centimeters and Body Mass Index BMI from a…
A: The given data is as…
Q: Use the contingency table to the right to (a) calculate the marginal frequencies, and (b) find…
A: Given contingency table is,Size of restaurantRating Excellent FairPoorSeats 100 or fewer…
Q: An experiment was conducted to compare the alcohol content of soy sauce on two different production…
A: The null and alternative hypotheses are given as:Vs Level of significance: (assumed)Let us assume…
Q: A national polling agency conducted a survey based on a random sample of Americans. The poll finds…
A: The objective of the question is to determine the confidence interval for the percentage of all…
Q: A professor is interested in understanding the factors on which the grades a student obtains in her…
A: R2 = 0.78n=120The adjusted R2 is given by,
Q: A bicycle safety organization claims that fatal bicycle accidents are uniformly distributed…
A: Given the data:H0: The distribution of fatal bicycle accidents throughout the week is uniform.Ha:…
Q: In a test of hypothesis, the null hypothesis is that the population mean is greater than or equal to…
A: Population mean μ=37Population variance σ2=10.6Critical value: μ<37μ1=35.27At 5% significance…
Q: Systolic blood pressure levels above 120 mm Hg are considered to be high. For the 100 systolic blood…
A: Suppose μ is the true population mean systolic blood pressure level.
Q: 4.1-3. Let the joint pmf of X and Y be defined by x + y 32 f(x, y) = a. Find fx (x), the marginal…
A: Joint p.m.f of X and Y is defined by
Q: Given the following bivariate data: 10 15 20 30 5.00 4.75 4.75 4.00 X Y a) Plot each point in the…
A: The number of observations is 5.
Q: The estimated regression equation for a multiple regression model involving two independent…
A: a)The multiple regression model is given as, .
Q: The table below contains pulse rates after running for 1 minute, collected from a sample of females…
A: The mean pulse rate after running for 1 minute of females who do not drink is 97 beats per minute.
Q: Given are five observations for two variables, and y. The estimated regression equation is ŷ = 0.2…
A: The estimated regression equation is .
Q: 8) There are 10 balls in a box, 3 are red and 7 are blue. Calculate the binomial probability…
A: Given that10 balls in a box 3 red balls, 7 blue To find the probability to obtain 5 red balls :
Q: The coefficient of correlation in a simple regression analysis is = -0.6. The coefficient of…
A: Correlation=r=-0.6
Q: Which of the following is not a condition that needs to be met to develop a confidence interval for…
A: IndependenceWhen constructing a confidence interval for a proportion, it is assumed that the…
Q: Part A: Individual All-Around Finals We will first look at the floor exercise scores in the…
A: The data is given on the exercise score for males and females in all-around…
Q: Eco-Cook deep fryer has a mean time before failure of 3838 months with a standard deviation of 55…
A: From the provided information,

Step by step
Solved in 4 steps with 13 images

- The quality inspector of a certain factory states that 3% of outgoing products have major defects. A sample of 200 products have 5 defective products. Is there strong evidence that the statement of the quality inspector is true? Use ?=0.05 Find the: Parameter of interest: ? Null hypothesis: ? Alternative hypothesis: ? Test statistic: ? Reject H0 if: ? Computations: ? Conclusion: ?A local tennis pro-shop strings tennis rackets at the tension (pounds per square inch) requested by the customer. Recently a customer made a claim that the pro-shop consistently strings rackets at lower tensions, on average, than requested. to support this claim, the customer asked the pro shop to string 6 new rackets at 68 psi. Suppose the two-tailed p-value for the test described above (obtained from a computer printout) is 0.07. Give the proper conclusion for the test. Use α = 0.05. a) There is sufficient evidence to conclude that μ, the true mean tension of the rackets, is less than 68 psi. b) There is insufficient evidence to conclude that μ, the true mean tension of the rackets, is less than 68 psi. c) Accept H0 and conclude that μ, the true mean tension of the rackets, equals 68 psi. d) Reject H0 and conclude that μ, the true mean tension of the rackets, equals 68 psi.Consider the hypotheses below. H0: μ≥60 H1: μ<60 Given that x=55.3, s=6.9, n=25, andα=0.10, complete parts a and b below. What conclusion should be drawn? The critical value(s) is(are) (Round to three decimal places as needed. Use a comma to separate answers as needed.) Determine the test statistic, tx. tx= (Round to two decimal places as needed.) What conclusion should be drawn? A.Reject H0. There is sufficient evidence to conclude that μ<60. BDo not reject H0. There is sufficient evidence to conclude that μ<60. C.Do not reject H0. There is not sufficient evidence to conclude that μ<60. D.Reject H0. There is not sufficient evidence to conclude that μ<60. b) Use technology to determine the p-value for this test.
- A local tennis pro-shop strings tennis rackets at the tension (pounds per square inch) requested by the customer. Recently a customer made a claim that the pro-shop consistently strings rackets at lower tensions, on average, than requested. To support this claim, the customer asked the pro shop to string 6 new rackets at 68 psi. Suppose the two-tailed P-value for the test described above (obtained from a computer printout) is 0.07 Give the proper conclusion for the test. Use a= 0.05A can of soda is labeled as containing 16 fluid ounces. The quality control manager wants to verify that the filling machine is not over-filling the cans. Complete parts (a) through (d) below. (a) Determine the null and alternative hypotheses that would be used to determine if the filling machine is calibrated correctly. H0: ▼ sigmaσ muμ pp ▼ nothing H1: ▼ pp muμ sigmaσ ▼ less than< equals= not equals≠ greater than> nothingConsider the null hypotheses for the following multinomial experiments. (Give your answers correct to two decimal places.) (a) Determine the critical value and critical region that would be used in the classical approach to test Ho: P(1) = P(2) = P(3) = P(4) = 0.25, with ? = 0.01.?2 (b) Determine the critical value and critical region that would be used in the classical approach to test Ho: P(1) = 0.25, P(2) = 0.40, P(3) = 0.35, with ? = 0.01.?2
- A can of soda is labeled as containing 10 fluid ounces. The quality control manager wants to verify that the filling machine is not over-filling the cans. Complete parts (a) through (d) below. (a) Determine the null and alternative hypotheses that would be used to determine if the filling machine is calibrated correctly. H0: ▼ sigmaσ muμ pp ▼ not equals≠ greater than> less than< equals= nothing H1: ▼ muμ pp sigmaσ ▼ not equals≠ less than< greater than> equals= (Type integers or decimals. Do not round.)a. Which of the two excel outputs above is the correct result of the data?b. What is the appropriate set of hypotheses for this test?c. From the given results above, which test is appropriate to test the significant difference between the heat-producing capacities of the coal from the mines?d. What is the t- critical value?e. What is the p-value?f. At α=0.05, what is the correct decision?Choose the correct answer When we perform a chi-square test for independence, the null hypothesis states that the two variables are a. independent b. related c. normally distributed d. mutually exclusive
- A medical researcher says that less than 86% of adults in a certain country think that healthy children should be required to be vaccinated. In a random sample of 200 adults in that country, 83% think that healthy children should be required to be vaccinated. At α=0.05, is there enough evidence to support the researcher's claim? Complete parts (a) through (e) below. (a) Identify the claim and state H0 and Ha. (b) Find the critical value(s) and identify the rejection region(s). (c) Find the standardized test statistic z. (d) Decide whether to reject or fail to reject the null hypothesis and interpret the decision in the context of the original claim.The true average diameter of ball bearings of a certain type is supposed to be 0.5 in. A one-sample t test will be carried out to see whether this is the case. What conclusion is appropriate in each of the following situations? (a) n = 12, t = 1.56, ? = 0.05 Reject the null hypothesis. There is sufficient evidence that the true diameter differs from 0.5 in.Reject the null hypothesis. There is not sufficient evidence that the true diameter differs from 0.5 in. Do not reject the null hypothesis. There is sufficient evidence that the true diameter differs from 0.5 in.Do not reject the null hypothesis. There is not sufficient evidence that the true diameter differs from 0.5 in. (b) n = 12, t = −1.56, ? = 0.05 Reject the null hypothesis. There is sufficient evidence that the true diameter differs from 0.5 in.Reject the null hypothesis. There is not sufficient evidence that the true diameter differs from 0.5 in. Do not reject the null hypothesis. There is sufficient evidence…A neighborhood of 45 homes found that 75% (SD=2.1) had at least one pet. The city-wide average for neighborhoods is 71%. Find the critical value of t and the value of t we obtain (or observe) presuming a 2-tailed test. Also, calculate the effect size. Lastly, write a statement of the hypotheses with your findings.