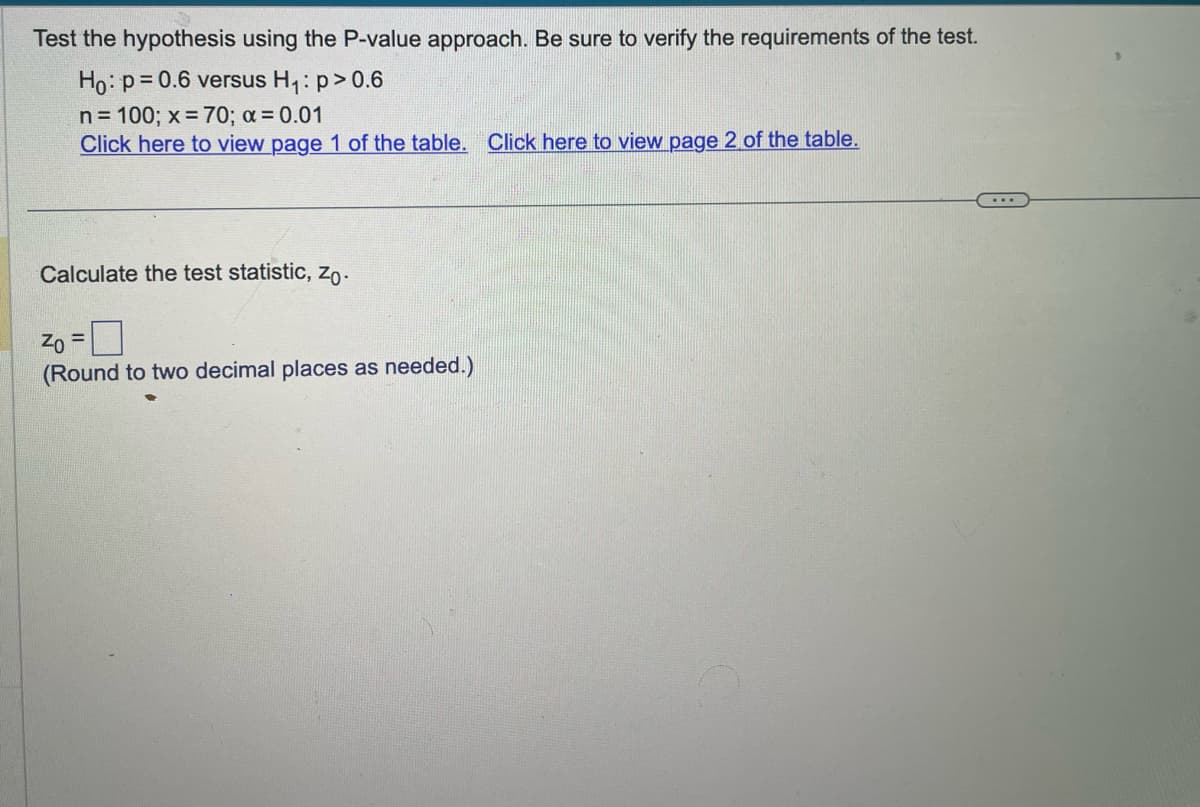
Test the hypothesis using the P-value approach. Be sure to verify the requirements of the test. Ho: p=0.6 versus H₁: p > 0.6 n = 100; x = 70; α = 0.01 Click here to view page 1 of the table. Click here to view page 2 of the table. Calculate the test statistic, Zo. 20 =0 Zo (Round to two decimal places as needed.)


Q: (a) What proportion of pregnancies lasts more than (b) What proportion of pregnancies lasts between…
A:
Q: Regression was used to determine if the number of beers a person drinks predicts blood alcohol…
A: The intercept is -0.013 and the slope is 0.018.
Q: QUESTION 1 Samuel Morse determined that the percentage of "t's" in the English language in 1836 was…
A: Sample size n =750 Favorable cases x =90
Q: Determine whether the given correlation coefficient is statistically significant at the specified…
A: r = −0.599 α = 0.01 n = 11 We have to identify whether the given correlation coefficient is…
Q: Find the range for the given data set, 22,52,89,63,41,71,14,83,96,12
A: Answer: From the given data, 22,52,89,63,41,71,14,83,96,12 Sample size(n) = 10
Q: 15) The football conch randomly selected fifteen players and timed how long each player took to…
A: Normality assumption can be checked using various methods. It can be checked using Kolmogorov…
Q: 4) The acceptance rate into medical school in the United States is reportedly 5.5%. A random sample…
A: The acceptance rate into medical school is 5.5%. The random sample of 2000 are selected. Let n=2000…
Q: If Cov(X,Y) = 0, then Var(X+Y) = Var(X-Y). True or False? O True
A: Given that, COVX,Y=0
Q: A simple random sample of size n is drawn from a population that is normally distributed. The sample…
A: Sample mean, x¯=106 Sample standard deviation, s=10
Q: What does this mean if the simple slope analysis looked like this?
A: Since the upper and lower lines in a simple slope analysis both increase and cross through the…
Q: A study was conducted to determine the proportion of people who dream in black and white instead of…
A: The given hypothesis is H0:p1=p2 versus H1:p1>p2.
Q: Which of the following probabilities indicates a relationship that is not statistically…
A: By statistically insignificant, we means that there is less difference between the measure of null…
Q: You intend to estimate a population mean with a confidence interval. You believe the population to…
A: The sample size (n) = 8 We need to find the critical value at confidence level 80%
Q: According to Harper's Index, 40% of all federal inmates are serving time for drug dealing. A random…
A: Answer:- According to the given information, Probability of success on a trial, p = 40% = 0.40…
Q: Determine if the correlation between the two given variables is likely to be positive or negative,…
A: Determine if the correlation between the two given variables is likely to be positive or negative,…
Q: A regression analysis of 117 homes for sale produced the following model, where price is in…
A: Price^=47.82+0.067Size
Q: The standard deviation of a sampling distribution: A. applies only to population data B. is always…
A: The standard deviation of a sampling distribution
Q: When an anthropologist finds skeletal remains, they need to figure out the height of the person. The…
A: The data is given as- Length of metacarpal Height of person 44 173 48 183 41 162 39 159…
Q: A random variable has CDF What is p₂? F₁ = 0.25, 1, 0, 1, 2 i = 3
A: From the given CDF, we can see that: P(X < 0) = F(0) = 0 P(X < 1) = F(1) = 0.25 P(X < 2) =…
Q: agency consumer safety. One thing the FDA regulates is the allo- insect parts in various foods. You…
A: Sample size n =37 Sample mean=79 Population standard deviation =10 NOTE:- According to bartleby…
Q: interval procedure to find the required confidence interval. n = 76, x= 31; 98% level O a 0.276 to…
A: Let p be the population proportion. Given that, n=76x=1C=98%=0.98α=1-C=1-0.98=0.021-α2=1-0.022=0.99…
Q: Samuel Morse determined that the percentage of "t's" in the English language in 1836 was 10%. A…
A: Population proportion of letter t in English P=10%=0.10 Sample of size n=750 in which number of t's…
Q: Suppose we want to test the claim that the majority of adults are in favor of raising the voting age…
A: Here Claim Is Majority of adults are in favour of raising voting age to 21.
Q: Suppose that the walking step lengths of adult males are normally distributed with a mean of 2.7…
A: Population mean μ =2.7 Population standard deviation =0.2 Sample size n =63
Q: ard deviation 250 miles. We sample 25 geese. What is the standard error of the sample distribution?…
A: The population mean distance is 2500 miles and the standard deviation is 250 miles. Sample of 25…
Q: An apartment management company wants to explore the consequences of allowing residents to have…
A: When multiple regression is performed, we get a negative value of both the independent variables-…
Q: Suppose that X~ N(−11.6, 19.2) and that Z follows the standard normal distribution. Part 1. a)…
A: Ramdom variable X~ N(μ=-116 ,σ=19.2) Z=(x-μ)/σ be the z score and it is standard normal variates
Q: b) Determine the correct hypotheses for the claim that Fiona wants to test.
A: Fiona is the course authority for a particular university course. In this course, students submit an…
Q: Answer correctly and read the question correctly, If the question is done correctly, I will write a…
A: Given data: x y 1.7 8 1.9 3 1.8 8 2.2 11 0.4 2 1.3 3 2.8 12 2.1 7 1.4 7 2.2 4
Q: a. Identify the actual number of respondents who rated themselves as above average drivers. 1098…
A: Use the results from a survey of a simple random sample of 1234 adults. Among the 1234 respondents,…
Q: distribution as an appre Test of p=0.93 vs p*0.93 Sample X N 1 2,158 1902 Sample p 0.881372 95% CI…
A: Sample size n =2158 Favorable cases x =1902 NOTE:- According to bartleby guidelines expert can solve…
Q: What is the mean of the sample distribution? What is the R code to find the probability that this…
A: The population mean: μ=2500 Standard deviation: σ=250 Sample Size: n=25
Q: Nhs prevetion programe was released to prvent type 2 diabetes, provide data on what year was it most…
A: Given, NHS prevention program: to prevent Type 2 diabetes To find which year was it most effective
Q: The mean of 14 numbers in a data set is 43. A new number is included in the data set. It changes the…
A:
Q: Question 35 Let A and B be two disjoint events such that P(A) = 0.34 and P(B) = 0.2. What is P(A and…
A: We have given that, Let A and B be two disjoint events such that P(A) = 0.34 and P(B) = 0.2 Then,…
Q: Identify the type I error and the type Il error that corresponds to the given hypothesis. The…
A: Type I error: Type I error is "rejecting the null hypothesis when actually it is true". Given claim:…
Q: Which of the following is and advantage of sampling? risk of accepting bad lots Orisk of accepting…
A: Sampling method
Q: Find the following probability for the standard normal random variable z. a. P(Z = 3) e. P(-3≤z≤3)…
A: Note: As per our guidelines we are supposed to answer only 3 sub-parts of any questions so i am…
Q: Find the range for the given data set, 34,16,56,28,47,54,87,69,26,33
A: Answer: Given data set is, 34,16,56,28,47,54,87,69,26,33 Sample size (n) = 10
Q: pecialty: What is your gender? (F=female, M=male) and What is your specialty? (Accounting=C,…
A: The two categorical variables are Gender = (F= Female and M= Male) specialty= (Accounting=C,…
Q: FOR THIS RESPONSE PLEASE USE EXCEL. I need step-by-step calculations and formulas (formulas for…
A: Back Side Sitting 140 141 144 144 143 145 146 145 147 141 144 148 139 136 144 Sum=710…
Q: Suppose that X is a normally distributed with mean 29 and standard deviation is 8 find the given…
A: Population mean, μ=29 Population standard deviation, σ=8
Q: Given below is the joint probability distribution for the random variables X and Y: X 30 40 50 50…
A: y x 50 60 80 P(x) 30 0.5 0 0 0.5 40 0 0.3 0 0.3 50 0 0 0.2 0.2 P(y) 0.5 0.3 0.2 1…
Q: Identify the null hypothesis, alternative hypothesis, test statistic, p-value(s), c about the null…
A: Sample size n =11000 Favorable cases x =5720 Sample proportion p^=x/n =5720/11000 =0.52
Q: Use the confidence interval to find the estimated margin of error. Then find the sample mean. A…
A: To find the estimated margin of error, we need to subtract the lower bound of the confidence…
Q: Find the indicated margin of error. In a random sample of 194 college students, 75 had part-time…
A: The data is given as- Sample size : n=194 Number of persons having part-time job: x=75 Confidence…
Q: 3. Assume that a simple random sample has been selected from a normally distributed population and…
A: Sample size n =190 Sample mean=2650 Standard deviation =645
Q: If two regression coefficients bxy = 0.85 and byx = 0.52 Find the correlation coefficient (r) ?…
A: Answer: From the given data, If two regression coefficients are, bxy = 0.85 byx = 0.52
Q: A formal hypothesis test is to be conducted using the claim that the mean AC thermostat setting in…
A:
Q: A large airline company wants to investigate whether the distribution of ticket sales throughout the…
A: The effect size of the chi-square test is calculated using various methods. The effect size was…


Trending now
This is a popular solution!

Step by step
Solved in 3 steps

- a. Which of the two excel outputs above is the correct result of the data?b. What is the appropriate set of hypotheses for this test?c. From the given results above, which test is appropriate to test the significant difference between the heat-producing capacities of the coal from the mines?d. What is the t- critical value?e. What is the p-value?f. At α=0.05, what is the correct decision?The effectiveness of a new bug repellent is tested on 1616 subjects for a 10 hour period. (Assume normally distributed population.) Based on the number and location of the bug bites, the percentage of surface area exposed protected from bites was calculated for each of the subjects. The results were as follows: ?⎯⎯⎯=92x¯=92, ?=13 s=13 The new repellent is considered effective if it provides a percent repellency of at least 9090. Using ?=0.05α=0.05, construct a hypothesis test with null hypothesis ?≤90μ≤90 and alternative hypothesis ?>90μ>90 to determine whether the mean repellency of the new bug repellent is greater than 9090 by computing the following: (a) the degree of freedom (b) the test statistic The final conclusion is A. There is not sufficient evidence to reject the null hypothesis that ?≤90μ≤90. Our results do not provide enough evidence that the new bug repellent is effective. B. We can reject the null hypothesis that ?≤90μ≤90. Our results indicate that…For each of the following situations, identify whether the appropriate test is a paired t-test (for parameter µd) or a two-sample t-test (for parameter µ1 - µ2). Briefly explain your answer. Sixty students were matched by initial pulse rate, with the two with the highest pulse forming a pair, and so on. Within each pair, one student was randomly chosen to drink a caffeinated beverage, while the other one drank an equivalent amount of water. Their pulse rates were measured 10 minutes later, to test whether caffeine consumption elevates pulse rates. To determine whether lack of sleep increases appetite, researchers recruited 50 volunteers and randomly assigned 25 of them to sleep at least 8 hours a night and the other 25 to sleep at most 5 hours a night, for 3 days. Calorie intake was recorded for all 50 volunteers for the 3-day period.
- Q1. An anthropologist wants to collect data to determine whether the two different cultural groups that occupy an isolated Pacific Island grow to be different heights. The results of his samples of the heights of adult females are as follows Do these samples constitute enough evidence to reject the null hypothesis that the heights of the two groups the same? Set alpha to 0.05 1.What are the appropriate null and alternative hypothesis? 2. What is the Test statistics? 3.What is the value of the test statistic? 4. For a significance level of 0.05, what is the critical value? 5.What is the appropriate decision and conclusion?Use the data below to test the claim that the weight loss was greater with the low fat diet compared to the low carbohydrate diet. Use a 10% level of significance. Low Fat Low Carbohydrate x¯1=3.7lbs 1=5.2lb n1=57 x¯1=2.7 lbs1=4.9lb n1=62 Identify the tail of the test. What is the P-value? Will the null hypothesis be rejected? Is the initial claim supported?A random sample of 430 observations produced a sample proportion equal to 0.39. Find the critical and observed values of z for the following test of hypotheses using α=0.025. H0: p=0.30 versus H1: p≠0.30. Round your answers to two decimal places.
- A random sample of 460 observations produced a sample proportion equal to 0.36. Find the critical and observed values of z for the following test of hypotheses using α=0.02. H0: p=0.30 versus H1: p>0.30. Round your answers to two decimal places. zcritical =Enter your answer; z_criticalA researcher who wants to know whether the proportion of male births in a hospital is different from the established baseline of 51.07%, would like to test the following hypotheses: Ho:P = 0.51 vs. Ha :P = does not equal 0.51 a) Is the alternative hypothesis upper tail, lower tail, or two tailed? b) What do you conclude if the test results p-value of 0.03 at alpha value = 5% c) What do you conclude if the test results p-value of 0.08 at alpha value = 10%A random sample of 480 observations produced a sample proportion equal to 0.33. Find the critical and observed values of z for the following test of hypotheses using α=0.01. H0: p=0.30 versus H1: p>0.30. Round your answers to two decimal places. zcritical= zobserved=
- Using the information provided in the SPSS output. You are asked to make a decision about whether to reject the null hypothesis that the population value of gamma equals 0 (i.e., that there is no ordinary association in the population between frequency of prayer and health). If alpha = 0.05 and you use a non-directional alternative hypothesis, which of the following is true?) A. Since the p-value is larger than alpha, you do not reject the null hypothesis B. Since the p-value is less than alpha, you do not reject the null hypothesis C. Since the p-value is larger than alpha, you reject the null hypothesis. D. Since the p-value is less than alpha, you reject the null hypothesisuse technology to find the P value. P value =_. (round to three decimal places as needed.) should one reject the null hypothesis? or should one not reject the null hypothesis?As a bonus assignment a former student checked if your professor gave a statistically significant difference in grades between his male and female students. She based her study based on grades assigned in intermediate Econ courses (Econ 303, 305 and 317) and her sample included nm = 485 male students and nf = 264 female students. The average grades received were ?̅ = 84.6 and ?̅ = 85.8. The population standard ?? deviation were σ m = 12.0 and σ f = 11.4. Test the hypothesis that the two groups received different grades using a 95% confidence level and using the critical value approach