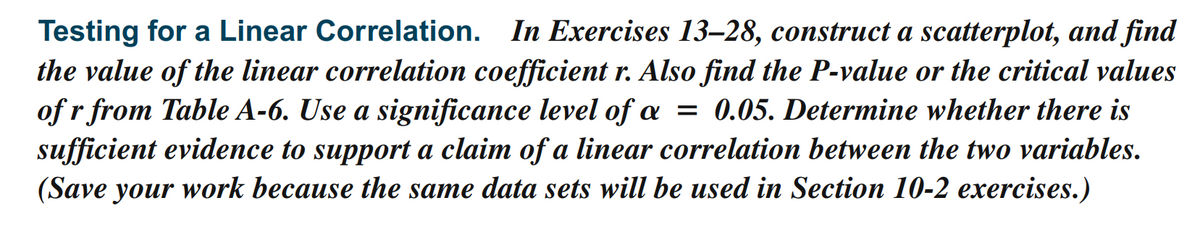
Testing for a Linear Correlation. In Exercises 13–28, construct a scatterplot, and find the value of the linear correlation coefficient r. Also find the P-value or the critical values of r from Table A-6. Use a significance level of æ = 0.05. Determine whether there is sufficient evidence to support a claim of a linear correlation between the two variables. (Save your work because the same data sets will be used in Section 10-2 exercises.)
Testing for a Linear Correlation. In Exercises 13–28, construct a scatterplot, and find the value of the linear correlation coefficient r. Also find the P-value or the critical values of r from Table A-6. Use a significance level of æ = 0.05. Determine whether there is sufficient evidence to support a claim of a linear correlation between the two variables. (Save your work because the same data sets will be used in Section 10-2 exercises.)

Glencoe Algebra 1, Student Edition, 9780079039897, 0079039898, 2018
18th Edition
ISBN:9780079039897
Author:Carter
Publisher:Carter
Chapter4: Equations Of Linear Functions
Section4.5: Correlation And Causation
Problem 2BGP

Related questions
Question
I would need some assistance with problem nineteen, please?
![19. Lemons and Car Crashes Listed below are annual data for various years. The data are
weights (metric tons) of lemons imported from Mexico and U.S. car crash fatality rates per
100,000 population [based on data from "The Trouble with QSAR (or How I Learned to Stop
Worrying and Embrace Fallacy)," by Stephen Johnson, Journal of Chemical Information and
Modeling, Vol. 48, No. 1]. Is there sufficient evidence to conclude that there is a linear correla-
tion between weights of lemon imports from Mexico and U.S. car fatality rates? Do the results
suggest that imported lemons cause car fatalities?
ל
Lemon Imports
230
265
358
480
530
Crash Fatality Rate
15.9
15.7
15.4
15.3
14.9](/v2/_next/image?url=https%3A%2F%2Fcontent.bartleby.com%2Fqna-images%2Fquestion%2F4c9f623b-4f29-4ab8-8352-be423f4da8b7%2F40e1a95d-3505-43f3-b57c-27efbeb5ef69%2Fdv4rjb_processed.png&w=3840&q=75)
Transcribed Image Text:19. Lemons and Car Crashes Listed below are annual data for various years. The data are
weights (metric tons) of lemons imported from Mexico and U.S. car crash fatality rates per
100,000 population [based on data from "The Trouble with QSAR (or How I Learned to Stop
Worrying and Embrace Fallacy)," by Stephen Johnson, Journal of Chemical Information and
Modeling, Vol. 48, No. 1]. Is there sufficient evidence to conclude that there is a linear correla-
tion between weights of lemon imports from Mexico and U.S. car fatality rates? Do the results
suggest that imported lemons cause car fatalities?
ל
Lemon Imports
230
265
358
480
530
Crash Fatality Rate
15.9
15.7
15.4
15.3
14.9
Transcribed Image Text:Testing for a Linear Correlation. In Exercises 13–28, construct a scatterplot, and find
the value of the linear correlation coefficient r. Also find the P-value or the critical values
of r from Table A-6. Use a significance level of a = 0.05. Determine whether there is
sufficient evidence to support a claim of a linear correlation between the two variables.
(Save your work because the same data sets will be used in Section 10-2 exercises.)
Expert Solution
This question has been solved!
Explore an expertly crafted, step-by-step solution for a thorough understanding of key concepts.

Step by step
Solved in 4 steps with 3 images

Recommended textbooks for you
Glencoe Algebra 1, Student Edition, 9780079039897…
Algebra
ISBN:
9780079039897
Author:
Carter
Publisher:
McGraw Hill

Big Ideas Math A Bridge To Success Algebra 1: Stu…
Algebra
ISBN:
9781680331141
Author:
HOUGHTON MIFFLIN HARCOURT
Publisher:
Houghton Mifflin Harcourt
Glencoe Algebra 1, Student Edition, 9780079039897…
Algebra
ISBN:
9780079039897
Author:
Carter
Publisher:
McGraw Hill
Big Ideas Math A Bridge To Success Algebra 1: Stu…
Algebra
ISBN:
9781680331141
Author:
HOUGHTON MIFFLIN HARCOURT
Publisher:
Houghton Mifflin Harcourt