Tests of Between-Subjects Effects Mean Square Dependent Variable: Game Score Type Sum Source of Squares Sex 029 117.042 473 Handedness 6004 000 000 605 Sex Handedness 210 333 2 624 051 Error 3913.250 18 Total 232005.000 a.R Squared 618 (Adjusted R Squared 512) From the image table and your own, is there a significant main effect of sex using an alpha of 0.057 Yes O No Sig Partial Eta Squared
Tests of Between-Subjects Effects Mean Square Dependent Variable: Game Score Type Sum Source of Squares Sex 029 117.042 473 Handedness 6004 000 000 605 Sex Handedness 210 333 2 624 051 Error 3913.250 18 Total 232005.000 a.R Squared 618 (Adjusted R Squared 512) From the image table and your own, is there a significant main effect of sex using an alpha of 0.057 Yes O No Sig Partial Eta Squared

MATLAB: An Introduction with Applications
6th Edition
ISBN:9781119256830
Author:Amos Gilat
Publisher:Amos Gilat
Chapter1: Starting With Matlab
Section: Chapter Questions
Problem 1P

Related questions
Question
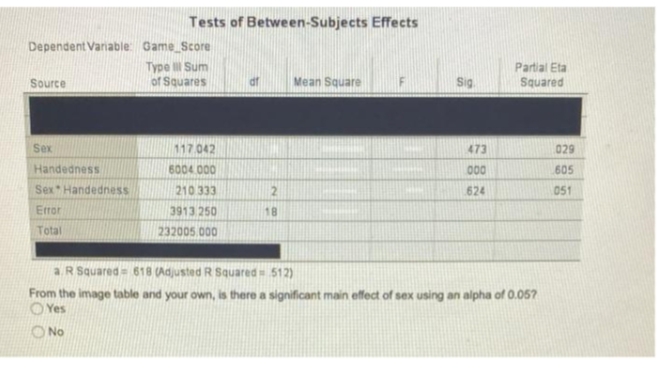
Transcribed Image Text:Tests of Between-Subjects Effects
df
Mean Square
Dependent Variable: Game Score
Type Ill Sum
of Squares
Source
Sex
117.042
473
029
Handedness
6004 000
000
605
Sex Handedness
210 333
624
051
Error
3913 250
18
Total
232005.000
a.R Squared 618 (Adjusted R Squared
512)
From the image table and your own, is there a significant main effect of sex using an alpha of 0.057
OYes
No
2
Sig
Partial Eta
Squared
Expert Solution
This question has been solved!
Explore an expertly crafted, step-by-step solution for a thorough understanding of key concepts.

Step by step
Solved in 2 steps

Recommended textbooks for you
MATLAB: An Introduction with Applications
Statistics
ISBN:
9781119256830
Author:
Amos Gilat
Publisher:
John Wiley & Sons Inc

Probability and Statistics for Engineering and th…
Statistics
ISBN:
9781305251809
Author:
Jay L. Devore
Publisher:
Cengage Learning

Statistics for The Behavioral Sciences (MindTap C…
Statistics
ISBN:
9781305504912
Author:
Frederick J Gravetter, Larry B. Wallnau
Publisher:
Cengage Learning
MATLAB: An Introduction with Applications
Statistics
ISBN:
9781119256830
Author:
Amos Gilat
Publisher:
John Wiley & Sons Inc
Probability and Statistics for Engineering and th…
Statistics
ISBN:
9781305251809
Author:
Jay L. Devore
Publisher:
Cengage Learning
Statistics for The Behavioral Sciences (MindTap C…
Statistics
ISBN:
9781305504912
Author:
Frederick J Gravetter, Larry B. Wallnau
Publisher:
Cengage Learning

Elementary Statistics: Picturing the World (7th E…
Statistics
ISBN:
9780134683416
Author:
Ron Larson, Betsy Farber
Publisher:
PEARSON

The Basic Practice of Statistics
Statistics
ISBN:
9781319042578
Author:
David S. Moore, William I. Notz, Michael A. Fligner
Publisher:
W. H. Freeman

Introduction to the Practice of Statistics
Statistics
ISBN:
9781319013387
Author:
David S. Moore, George P. McCabe, Bruce A. Craig
Publisher:
W. H. Freeman