) Tests of the fidelity and the selectivity of 190 radios produced the results in the table below. Fidelity Average 12 Low High 31 Low 7. Selectivity Average High 35 59 18 15 13 At a= 0.01 level of significance, test the null hypothesis that fidelity and selectivity are independent.
) Tests of the fidelity and the selectivity of 190 radios produced the results in the table below. Fidelity Average 12 Low High 31 Low 7. Selectivity Average High 35 59 18 15 13 At a= 0.01 level of significance, test the null hypothesis that fidelity and selectivity are independent.

College Algebra (MindTap Course List)
12th Edition
ISBN:9781305652231
Author:R. David Gustafson, Jeff Hughes
Publisher:R. David Gustafson, Jeff Hughes
Chapter8: Sequences, Series, And Probability
Section8.7: Probability
Problem 7E: List the sample space of each experiment. Selecting a letter of the alphabet

Related questions
Question
Q6c
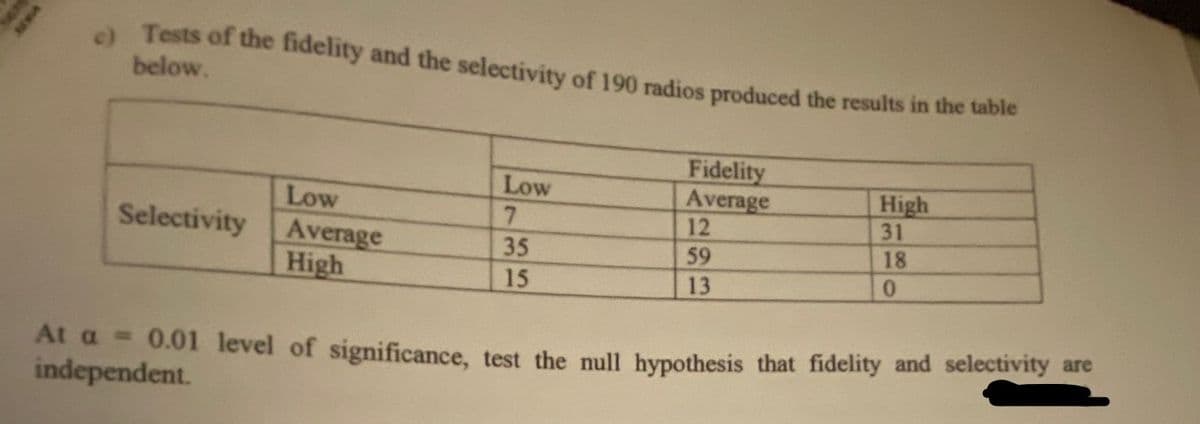
Transcribed Image Text:)Tests of the fidelity and the selectivity of 190 radios produced the results in the table
below.
Low
Selectivity Average
Low
7.
Fidelity
Average
12
High
31
18
35
High
59
13
15
0.
At a = 0.01 level of significance, test the null hypothesis that fidelity and selectivity are
independent.
Expert Solution
This question has been solved!
Explore an expertly crafted, step-by-step solution for a thorough understanding of key concepts.

Step by step
Solved in 5 steps with 6 images

Recommended textbooks for you
College Algebra (MindTap Course List)
Algebra
ISBN:
9781305652231
Author:
R. David Gustafson, Jeff Hughes
Publisher:
Cengage Learning

College Algebra (MindTap Course List)
Algebra
ISBN:
9781305652231
Author:
R. David Gustafson, Jeff Hughes
Publisher:
Cengage Learning